Stochastic, this is an oscillating indicator (as oppose to trending indicator). This is one of the most popular indicators out there. For me this is my favorite indicator. Many times this amazing indicator has helped me avoid bad trades, and spot a high profit entry. Developed by George C. Lane in the 50s, according to him, this indicator doesn't follow the volume or price, but the momentum of the price. As another article describe, "as a accelerating rocket climbs up, it will loose acceleration, slows down, before it starts falling". Stochastic is best used to show the weakening of momentum and point out the possible reversal signal. Let’s goes deeper into this indicator.
Fast, slow, full stochastic
Stochastic indicators is lines oscillating between 0 and 100 level. The 2 lines labelled as %K and %D. Usually we call the %K as “fast line” and we call the %D “Slow line”.
Stochastic first developed by George C Lane as "Fast Stochastic". On fast stochastic, there are 2 lines, %K and %D. There are 2 inputs for the fast stochastic, first is the period (default is 14); and second is the smoothing of %D line (by default is 3). The %K and %D line is calculated by this formula:
- %K = (Current Close - Lowest Low)/(Highest High - Lowest Low) * 100
- %D = 3-bar SMA of %K
where a period is given (by default, 14) the lowest low and highest high is within the period.
The %K line will be very choppy on fast stochastic, where George Lane will enter and exit the market based on the %D line. Later on, the Slow Stochastic was developed.
In slow stochastic, the %K line is smoothed out (by 3 SMA). The 2 parameter for slow stochastic is the period (by default 14) and the smoothing of %D line (by default is 3). The slow stochastic is more reliable because the %K line is smoothed out. What we have in slow stochastic is:
- %K = 3-bar SMA of fast-stochastic-%K
- %D = 3-bar SMA of %K above
What we mostly have now in our software is the Full Stochastic. Full stochastic is basically the same as slow stochastic, but there are 3 input parameter:
- input for period (by default, 14, or 5),
- smoothing for the %K line (by default, 3),
- parameter to calculate the %D line (by default, 3).
The only difference between full stochastic and slow stochastic is the smoothing of %K line can be customized.
(P.S.: Many articles saying that, default stochastic 14,3,3, is stochastic for 14 days. There is a misconception there, the 14 period is determine by candles. If we using daily chart, it will be 14days. If we are using hourly chart, it will be 14 hours)
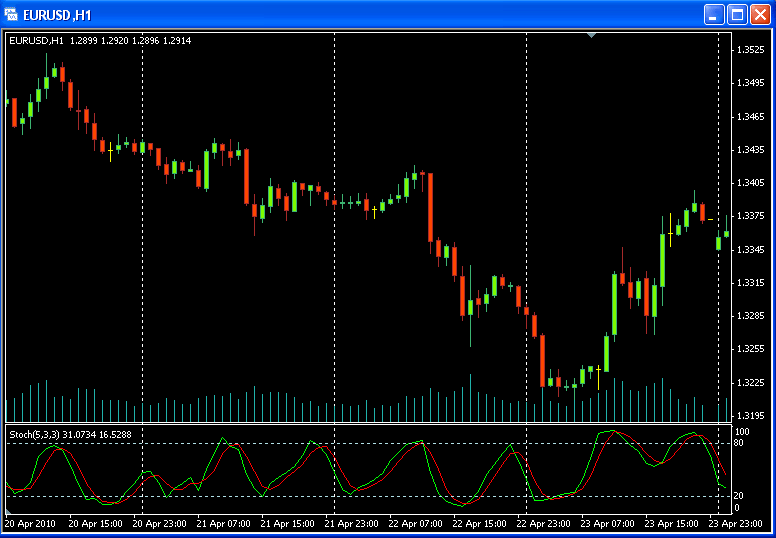
This is how a stochastic (5,3,3) looks like
Overbought / Oversold.
The lines at stochastic oscillate between level 0 and 100. When it’s above level 80, we consider the market is overbought. When it’s below the level 20, we consider the market is oversold. This does not mean that we will go short when the stochastic shows 80 and above, and vice versa. On some strong trend, the stochastic will stay above 80 (or below 20) for some times and reversal not happening.
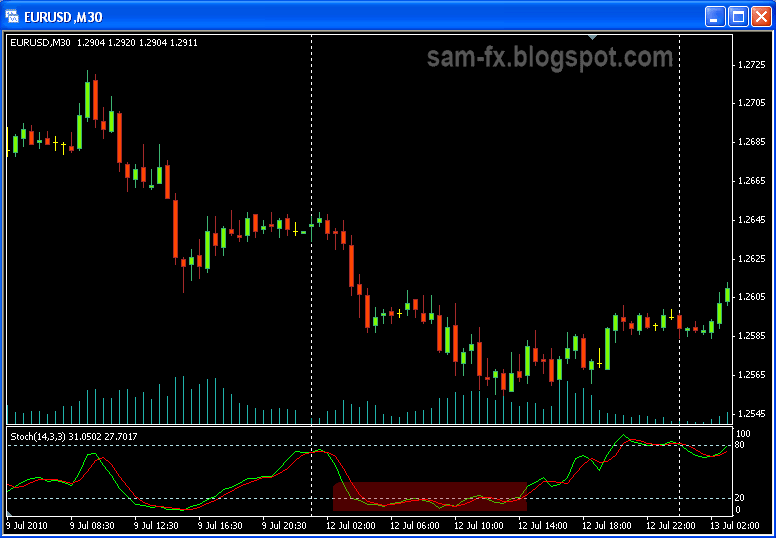
How I use this level is, consider them as my ‘non trade area’. When the stochastic shows 80 and above, I would think twice before going long. When the stochastic shows 20 and below, I would think twice before going short. This helps me filter out some of the bad trades.
Notice how in strong trend, the stochastic tends to be choppy and stays below 20 level.
In this example, the stochastic stays above the 80 level for some time
Crossover
The %K line in stochastic is considered as bullish; the %D line is considered bearish. When the %K line cross above the %D line and the stochastic is moving up, the market is turning into bullish market, vice versa for bearish market. However I do not jump into the market straight away when the lines cross. Usually confirmation is needed before we can confirm the reversal is happening.
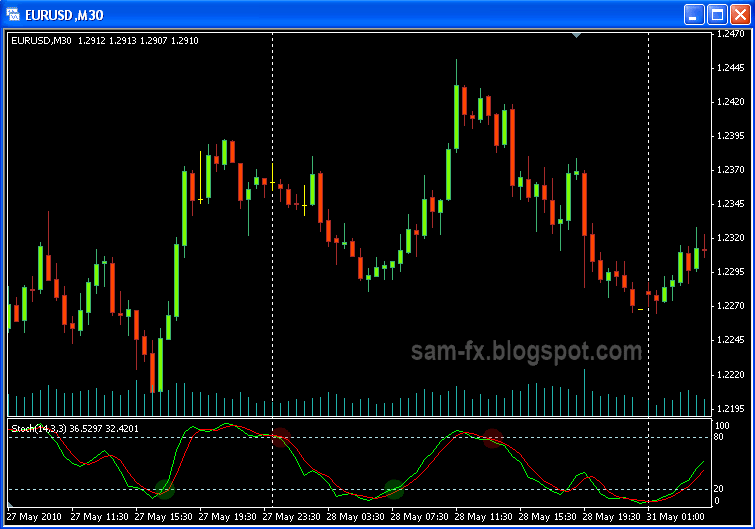
How I use this is, when the stochastic is at above 80 level, I wait for the %D to cross the %K, then when they crossover and move down into below 80 level, its good sign to go short; vice versa for going long.
Some good place to take a short (red circle) and long (green circle)
Another example showing possible short (red circle) and long (green circle) area
Divergence
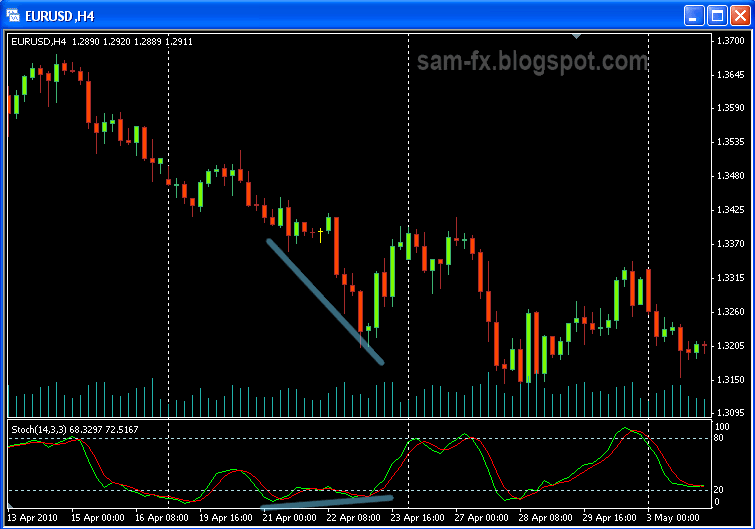
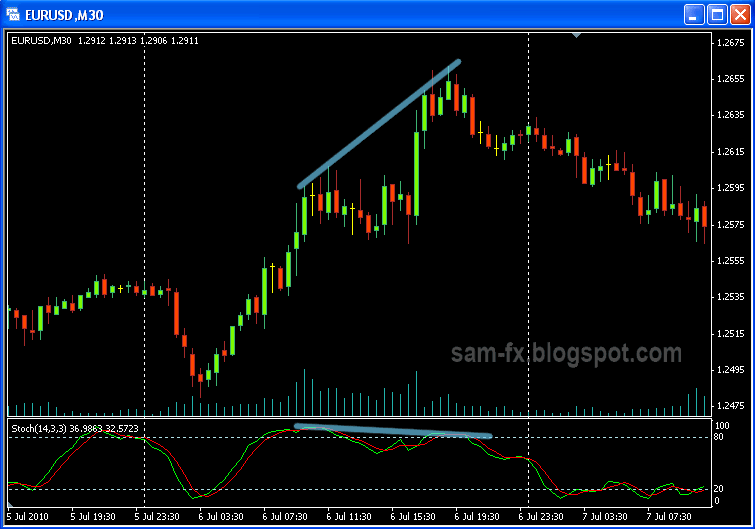
Divergence is another good way to use stochastic indicator. In a bullish trend, when price making a new high while stochastic making a lower high, there is good chance of reversal. When the price making a lower low but the stochastic making a higher low; there is chance of reversal.
Price are making new low, but stochastic are making higher low. A divergence.
Price is making new high, stochastic making lower high. A divergence
Time
As BK mention in his webminar, here is another way to use stochastic. The market is like a football game between the bear and the bull. When the %K line is above the %D in stochastic, the bull is holding the ball, and vice versa for the bear.
Watching the stochastic indicator, we can estimate if the bull is stronger or bear is stronger. We estimate this by checking on who is ‘holding the ball’ for longer period of time.
There you go few tips and information about the stochastic indicator. To recap, here is some important part
- When the stochastic is above 80, its ‘no long’ zone, think twice and confirm with other indicators before going long.
- When the stochastic is below 20, its ‘no short’ zone. Think twice and confirm with other indicators before going short.
- When the stochastic is above 80, if the %D is cross above %K; and they are moving out to below 80 level, its good sign to go short
- When the stochastic is below 20, if the %K is cross above %D; and they moving out to above 20 level, it is good sign to go long.
- Divergence is useful way to monitor possible reversal on the price.
Reference:
- Stockcharts.com (http://stockcharts.com/school/doku.php?id=chart_school:technical_indicators:stochastic_oscillator)
- Forex-indicators.net (http://forex-indicators.net/stochastic)

