I read this from a book, so I think I share here too. When the price of the pair is near to Moving Averages (example EMA), it is closer to its true value. When the pair is moving further from the MA, it is said that the pair is overpriced. The Moving average can be at any value. The closer the price to the Moving Average, the more value to the price. When price moving away from moving average, it is overprice; and when we bought overpriced pair, we hope for bigger fool to bought it too and make the price go further. So the conclusion is, when the price is closer to MA, the price is more worth the value.
Read more!
Monday 30 August 2010
Friday 27 August 2010
books: Getting Started in Forex Trading Strategy
I finish reading this book today while waiting for my friend for 2 hours. This is a book written by Michael Duane Archer. He is also the person that record down the famous “Goodman Swing Count System”. This book mainly focuses on technical analysis and codex strategy. It starts off by teaching us about market environment, wave system, and move on more detail on the strategy. Overall, this is a good book to read; and I admit I have learned a lot from it. Sold at MPH for around MYR35 at MPH (US$ 12 at Amazone), this is a bargain for a book too. If you like to have a preview of the book, you could click this link for Google Books.
Read more!
Thursday 26 August 2010
basic: Bollinger Band (part II)
Not long ago I have posted about Bollinger band indicator. Lately I have come across some more facts about the Bollinger band in my reading. Here I would like to share with you some of the important points I have come across. Although personally I not yet use Bollinger Band in my trading system, there are no doubt this is a good indicator and many successful traders using it.
Here are some additional points about Bollinger Band.
- Bollinger Band does not indicate buy or sell signals. It must be used in conjunction with other indicators.
- Bollinger Band can use to clarify the double tops/double bottoms pattern (“M” and “W” pattern)
- Close outside the Band usually indicates continuation pattern, and not reversal.
- The center line of Bollinger Band is SMA
- If the length of SMA being increase, the deviation should be increased. E.g. 20 period with 2-deviation, 50 period with 2.5 deviation.
- Touching the band dose not indicate sell or buy signal. Touching the band is useless information without confirmation with other indicators.
- New high/low outside the band follow by another high/low inside the band indicates highly chances of reversal.
- When double-bottoms are formed, a buy signal is indicated when first bottom penetrate the band and the second bottom remain above the band. The bottoms can be higher or lower than each other in any way.
- When double-tops are formed, a sell signal is indicated when first top penetrate outside and the second peak is below the upper band.
- A breakout is highly going to happened after Bollinger-squeeze. Bollinger band does not indicate the direction of the breakout.
- Using divergence and hidden-divergence can get higher probably of the breakout direction after Bollinger-squeeze.
- Bollinger Band period can be fine tuned to match your price. In a reversal in downtrend, the price needs to form a higher second low-point. The Band should hold support for second low. If the second low penetrates the band, the period can be increase. Same goes for the uptrend reversal.
The above are little information I manage to learn yesterday. Hope this is useful for you all.
Read more!
Wednesday 25 August 2010
A day scalping
24 August 2010, I spend the day scalping. This is rare chance I can glue myself in front of the monitor for couple of hours. I was going in aggressive today. And here is my result below.
Well of course this is in demo account. I not good at doing it at any live account yet.
Read more!
Tuesday 24 August 2010
basic: CCI indicator
CCI stands for Community Channel Index. It was developed by Donald Lambert in the 80s (I not sure if he has any relation with Adam Lambert though). The CCI was initially developed to measure the cyclical turns of the price. Now it is a popular indicator among others. Many uses have been developed for CCI over the years. One trader that made CCI famous was Ken Wood (a.k.a. Woodie). He is well known trader and developed one complete system that is profitable with CCI. I just came across this indicator not long ago, and decided to read more about it.
The CCI is calculated by the deviation of “Typical price” from Simple Moving Average of a certain period of time. The calculation can be found on stockcharts website (http://stockcharts.com/school/doku.php?id=chart_school:technical_indicators:commodity_channel_index_cci). The default period would be 20. But the recommended interval should be 1/3 of a complete price cycle (from low to low or from high to high). The 20 default period will be suitable for most situations.

This is how CCI chart looks like. I have only plotted out the zero-line. In the price chart I have draw out 20SMA line. Notice how CCI behave around the zero line when price is above/below the 20 SMA
In short, the CCI represent deviants of how far the price is away from the Moving Average. There are many usages for this indicator. Here I would highlight some of the most common one.
Overbought and Oversold.
When the CCI goes above 100, the market is consider overbought. When the CCI goes below -100, it is consider oversold. The 200 and -200 mark will consider strongly overbought and oversold. Usually traders will look for reversal around this area.
“Zero line reject”
If CCI lines bounce at the zero line (or near the zero line), it is most likely the price going to reverse too. This is one of Ken Wood’s methods. If we draw a moving average line on the price chart, we could observe that the place where “zero line reject” happens, is the place where price see the moving average line as support/ resistance.
Zero line cross
When the prices cross above the zero line, it is bullish sign. It is good indication to go long. Same goes if the price crosses below the zero line, it is good signal to go short.
Divergence
Like other oscillator indicator, CCI can be use in divergence trading too. For more information on divergence, you may visit my post here.
Trend line
Ken Wood introduces trading method based on trend line. Not to be confused with trend line at price chart, this is trend line at the CCI. The method is similar to drawing trend line on the price. We go short or long based on the trend line break.
There you go. Few of the uses of CCI. I still learning to use this indicator, and will post more example soon
Read more!
Monday 23 August 2010
"so suprise me U rather pay money for gambling in Forex instead of this good oppotunity"
I have this statement from a friend. Apologies for the spelling mistake, I have to leave the sentence in tact Well it all started when he ask me to join some business course to teach about online selling (at eBay). The course cost few thousands bucks and teaches about online selling and marketing by some so-called experts, and guarantees 5 figure income a day. Like other people that is motivated he is very motivated to join the course. I have told him politely is not the course I would join
So surprise he said this to me at desperation. I not like it when people say that. When you study and know what you are doing, it’s not “Gambling”. Well I would start my online business soon. I might spend hundreds or thousands of bucks on books and other resource too. Just that I not really into any course at this point. There’s no point arguing with my friend too. I hate it when people put trading together with gambling, this is very narrow minded. Wish him all the best in the course, and hope he break even soon.
Read more!
Friday 20 August 2010
I have miss the trade (19 - Aug - 2010)
There seems to be good price movement on the EU on 19th. Too bad I have missed it totally. Check out the chart below. If I have entered at the start of the trend, it is 2 way trade, and easily yield around 200 pips alone that day. The indicators are taken out from the chart for clearity. Indicators can indicate the start of the trend. But even if I have entered, I would have no way to confirm the trend is near ending. This is what I need to work out more. Too bad I am too caught up at my daily job (Just.Over.Broke) that I have missed out the trade.
Read more!
Thursday 19 August 2010
Retracement vs Reversal.
Retrace is a place where price make a pause, retrace a bit, and end up continuing moving on the trend. Reversal is a place where the price just turns and moves on opposite direction. I always having hard time identifying them both. Sometimes I mistaken a retracement for a reversal, and sometimes thinking it was reversal but only it is retracement. How to differentiate them both? After some research I found out few ways to differentiate reversal from retracement. Although they are not completely accurate all the time, they do give me better probability on my trade.
Candle stick pattern.
In my previous post about candle stick here and here, I talk about various pattern. The few common patterns are easily identified as reversal pattern. Some examples are engulfing, morning star, evening star, etc. At retracement, usually there are clutters of “indecisions” candles, such as doji and spinning top; which have very small bodies. But from my experience this is least accurate way to differentiate reversal and retracement. This is because those pattern are shown in retracement too.
Volume
Very little information on this. I learn this from investopedia website. (http://www.investopedia.com/articles/trading/06/Retracements.asp). According to the article, there will be large volume during reversal, and small volume during retracement. This is because retracement is form by profit taking by retail traders.
Trend lines
According to this forum post (http://forums.babypips.com/newbie-island/28589-retracements-reversals.html), trend lines are one simple way to identify reversal. According to the post, trend line is drawn on the tops and bottoms that form a channel. When the price breaks the channel with both new tops and bottom outside it, it could be a reversal.
Chart Patterns
Chart patterns are another way to differentiate reversal and retracement. According to the book “Chart Pattern Trader Supplement”, the patterns can be classified into 3 groups, continuation (retracement), reversal, and both. The most patterns that show continuation are triangles, flags and pennant. The most common reversal pattern is double tops (and double bottoms).
Read more!
Wednesday 18 August 2010
Newspaper article about Forex
In my previous post, I have posted about the small article in this newspaper. Now I would like to post the rest of the articles. The “Financial Weekly” from SinChew newspaper is my favorite section. Published weekly on Monday, it talks about stocks, options, property and (sometime) Forex. I have learned many from this newspaper, from technical analysis to property to even Feng Shui. This week is the first time I have saw this newspaper written about Forex. This is first time so I would like to share the article here. Below is the article I have scan. Please give time for the image to load. Enjoy your reading.


(News from SinChew “Financial weekly”, 16th August 2010)
Read more!
Tuesday 17 August 2010
Newspaper article encourage short-term trading & scalping
With majority of traders out there encouraging long term trading, its surprise to see an article that encourage short term trading. It’s even more surprising to see that scalping is mentioned in the article. Usually “short term” and “scalping” are big NO area for majority of traders out there. This is interesting so I going to share the article.
In summary, the article said that traders like us are tip of the iceberg in the marketplace, “counter trend thinking” is important. The professional in the article mention is better to trade at time stock market is close for less movement (range trading? This is also contra to popular believe). And the professional in the article suggest short term trading, and even scalping. He mentions short term trading need a lot of time for monitoring. He suggested “Speed Strategy”, in short “fast in, fast out”. He mentions that shorter term might yield higher return in long term. He thinks that there is no 100% accurate system in forex, and no strategy can be used forever, we need to adjust according to market in different time. “If there is doubt, it is better not to enter”.
(News from SinChew “Financial weekly”, 16th August 2010)
Read more!
Monday 16 August 2010
Long term trader or short term trader?
There are many people always stress that long term trading is the right thing. Personally I feel that there are no right or wrong. A trader chooses the style that best suits him or her. There are time where shorter time frame yield more pips, and there are time where longer timeframe gives more advantages. Read more below.
Here I would highlight time where intraday trading within 4 days (11, 12, 13, 16 August 2010; EU) would get more pips than long term traders for the 4 days. The scenario is entering when the market starts trending. The pips are roughly calculated based on the middle of the trend, and not the most tops and most bottom. Within the 4 days, intraday trader yields roughly 670pips (picture with H1 chart) , while longer term trader who hold through the period would take roughly 370pips (picture with H4 chart)
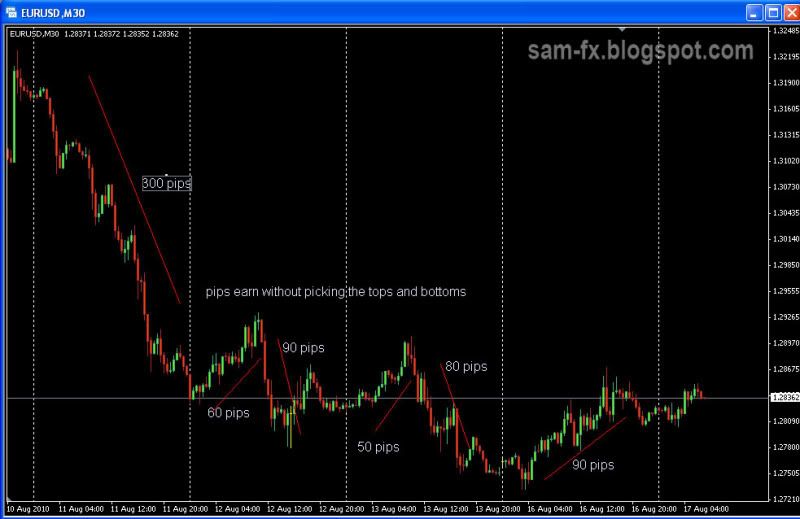
This is using hour (or 30 minutes) chart doing intraday trading, yielding almost 670pips in 4 days.
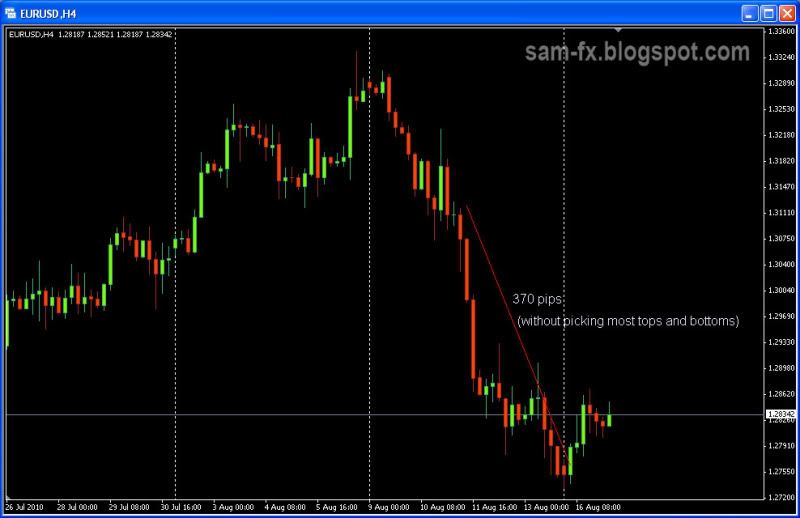
This is using longer term, within 4 days the chart move roughly 370pips
Read more!
Friday 13 August 2010
books: The Complete Guide to Day Trading
Not long ago I publish post about trading style. There are no rights or wrong about what you choose, some may choose swing trading, day trading or even scalping. Here I would like to recommend one book I read not long ago: The Complete Guide To Day Trading by Markus Heitkoetter.
The book not just talk about forex, but other kinds of trading also, such as stock, futures, options, etc. The author starts of by introduction to day trading, and selecting the market that best fits you. The books move on deeper on strategy and other information.
This book definitely helps those who into day trading. Quote from the book “My Objective: I am determined that this book will save you both money and time when it comes to your trading goals. I’m convinced that it will help you become the trader you want to be.”
Read more!
Wednesday 11 August 2010
tips: trailing stops
Trailing stops is a technique to yield maximum return from a strong trend. Many strategies apply trailing stops as the exit strategy. Use this wisely and it can bring a lot of profit. However like other strategy this has pro and cons also. Let us look at how to use trailing stops.
Trailing stops is moving your stop lost after the price have move significant amount. This can ensure you are safe if the price decided to suddenly move back; in the same time can let you trail the price for maximum profit.
There might be different methods of setting stops; below is my method.
- The first stop depends on the strategy you use.
- When price move to significant amount and start consolidating, watch the price
- When price continue move along the trend, move the stop to the consolidating place
- I like to use the lowest level on the consolidating place add in spread and few pips
- Continue to do that when price move along
The photo below show how I perform trailing stops. I have removed the indicators to make the chart clearer.

Hope this will help you on your trading.
Read more!
Tuesday 10 August 2010
What types of trader are you?
There are many kinds of traders varies in the form of trading durations. There are no right or wrong on the duration you choose to trade. Some prefer longer term trading and some prefer short term. Let’s look at the pro and cons of each.
Scalping
I have to admit it, there is a scalper in me. I think there is a scalper in many traders. Scalping is basically trading very small time frame, within seconds to few minutes, and taking small pips for profit. Although many traders are against scalping, but I think this can be a complementary trading technique while you are trading other durations. Who can resist the thrill of getting small earning from the markets within seconds? The advantage of this method is fairly short time needed. The disadvantages is loss comes quickly too. A proper method is needed to be successful in scalping. Another disadvantage is spread have high impact on our profit target. Usually scalping best suitable for pairs with less spread, such as the EU.
Day Trading
Also called intraday trading. The trade usually last for several hours. Usually day traders will exit the trade by end of the day to avoid rollover cost and overnight risk. The advantages intraday trading are faster profit, and smaller risk. However the profit target is also smaller for this duration. The duration is not quite short for day trading and it’s harder to master. I have been learning for a while and still can’t get much profit on day trading. If manage properly this is a very profitable trading style.
Swing Trading
This is trading that last for intermediate long period. Usually a trade will last from within a day to few weeks. Majority of traders are using this trading style. The risk can be manage properly too. We do not need much time in front of computer to look at the chart. This gives us more time for our daily life. This is also less stressful to our mind compare to scalping and intraday trading. One disadvantage is that there is rollover cost when each trading day ends. This trading method is not easy to master too.
Position trading / Long term trading
This is long term trading. It is easiest to learn, and can get more pips in a single trade compare to shorter terms. Many successful traders are position trader. In this type of trading, very less time is required to monitor the chart everyday. This gives us more time in our life. Some traders only make one or two trade within a year. The disadvantages are we need to calculate the rollover cost, and the risks are larger. This is because with larger time frame chart, we need to set larger Stop Lost to prepare for smaller market move against the main trend.
There is no perfect trading style. You may find the one that suits you most. Hope this post will give some general pro and cons of each trading style and you can find the one that fits you most.
Read more!
Monday 9 August 2010
Tips: Which news and calendar?
While technical analysis is always paid attention to, fundamental analysis is not less important too. Together with technical analysis and fundamental analysis will give us high probability trade. Fundamental analysis is about the economic strength of a country, which indirectly will relate to the currency strength. One part of fundamental analysis will be watching news report. So which news source do you refer to? Here I will share some source that I reference.
Forexfactory calendar
This is my favourite! I would say this is the best source for my forex calendar. It will highlight every news report and put them into a nice list. Register a free account, and you can customize the calendar to match your timezone too! Very convenient. A small icon will show the importance of the economy report, and there are also small explanations for each news. The table is very nice layout according to time and date. There are also forecast, actual, and previous data too in the same table. Very convenient, we could look at everything at a glance.
For ForexFactory news, you can visit http://www.forexfactory.com/calendar.php
DailyFX calendar
This is another forex calendar. They layout each event properly. Everything is properly layout; and explanation are included too. This is as good as the ForexFactory calendar. For me personally I would still prefer ForexFactory calendar, but nonetheless this is one good calendar to refer to.
For DailyFX calendar, you can visit http://cdn.dailyfx.com/calendar/
Barron’s Economic Calendar.
This is another economic calendar. However I think the layout is not as clear cut as the previous tow. But it is worth to reference too. For the Barron’s economic calendar, you can visit http://online.barrons.com/public/page/barrons_econoday.html
ForexNews
This is a website dedicated for Forex news. You can view the latest news here. Beside that, other kinds of articles also available. Good resource for all forex trader. For your dose of forex news, you can visit http://www.forexnews.com/
CNBC news
Many traders get their economy news here. No matter you are forex traders or stock market investors, or other kind of traders. There are many detail news about economy here. To get your prompt CNBC news you can go to their website at http://www.cnbc.com/
Google News
Once of the recent page on the World Wide Web. The Google News feature news all over the world. You can use the powerful search function and key in your favourite pairs, and the related news will pop up. I like the feature that google will indicate when is the news updated. If you have google account, you may customize Google News to open economic news each time you visit the news section. To access google news, you can go to http://news.google.com
There are many other source for your economic calendar and news on the World Wide Web. You may come across some very useful one too. The above highlighted are just tip of the iceberg; but they are my favourite few.
There are many other source for your economic calendar and news on the World Wide Web. You may come across some very useful one too. The above highlighted are just tip of the iceberg; but they are my favourite few.
Read more!
Friday 6 August 2010
strategy: Indicator line cross
X Mark the spot. This couldn’t be more true for technical analysis. In many systems, line crossing is the trigger to enter, and also exit a trade. Here I will list down few of the more common one. Maybe this will give you idea in developing your own trading system.
EMA/SMA Lines cross
This should be the most famous trigger method. The trigger happens when a faster EMA (or SMA) line cross the slower one. And the exit usually when the lines cross in opposite direction. One famous example is the 5-13-62 system by Rob Booker. The system triggers enter condition when the 5EMA crosses the 13EMA. Another famous example is the 50EMA crosses the 200EMA.
Price crosses EMA line
This is another trigger similar to above one. The trigger happens when the price cross the EMA line. Example is the “5-minute-momo-trade” method I discussed some times ago. In this method false breakout are more frequent compare to above method. Confirmation with candle sticks pattern will bring more accuracy.
MACD / Signal line cross.
I have discussed this in my previous post about MACD. The buy/sell trigger happens when MACD cross above or below the signal line. The signal line is 9EMA of MACD, which move slower then the MACD line. When the MACD crosses above the signal line, its indication of uptrend. Confirmation with zero line crossing on MACD and other indicators are needed to make a good entry.
Stochastic line cross
The slow line and fast line in stochastic cross is good indication of trend turning. When the fast %K line cross above the slow line, it is one of the buy signal. But use this alone is not a good indication, confirmation with other indicators are needed to enter a trade.
Momentum line cross
I just learn this not long ago. It’s really amazing when I first saw it. Using 2 momentum lines in one indicator window. When the line with smaller period cross the longer period line, its good signal to trigger the trade. The system I saw actually uses 2 windows; one with 10 and 14 period momentum line, the other with 1 and 5 period momentum line.
RSI line cross.
I have yet to experiment with this. The idea is putting 2 RSI line in one indicator windows. The period of RSI is one shorter and one longer. When the shorter period RSI cross the longer period one, it is signal to enter a trade.
There are many other possible combination out there. The above are few that I just learned. Feel free to leave your comments here.
Read more!
Thursday 5 August 2010
tips: RSI in same indicator windows (MetaTrader 4)
I learn this from BK. Since this is a nice trick so I would share it here. The idea is to put RSI into same indicator window with other indicators. This will give clearer view and can make the overall view less complicated. This trick will show how to put multiple indicators in same windows in MetaTrader 4.
RSI with Stochastic
RSI and Stochastic are both oscillator indicator. It’s good to put them together to see if they both agreed with each other. Since they both oscillate between 0 and 100, it is suitable to be putting together too. At a glance we can know what RSI and stochastic are indicating. To put them together, just follow these few steps.
- Open your chart
- Insert Stochastic indicator; a new indicator window will appear.
- Insert level you prefer in Stochastic (maybe 20, 80 perhaps)
- On the navigator bar at left, expand “indicators”, and drag RSI into the indicator window.
- Add in the level you prefer in RSI too, but in different color for clear visuals.
RSI together with Stochastic Indicator in same window
RSI with MACD
RSI together with MACD in one indicator window. MACD are trending indicator. BK add in RSI in MACD so that he wont “forgot to check on RSI”. This is simply be done too. The RSI can be added in MACD with the following steps.
- Open your chart
- Insert MACD indicator. A new indicator window will appear
- Drag RSI indicator into MACD indicator window.
- Add in the level you wants in RSI.
RSI with MACD in same indicator window
Using this trick, you can put multiple indicators into one single window. For me the above 2 are the most useful combination so far.
Read more!
Wednesday 4 August 2010
basic: On Balance Volume Indicator
In my previous post I talked about volume in forex. Now I will talk about a volume based indicator. I just learn about this indicator not long ago. This is because I noticed that all the indicators I use are price-based. It’s time to pick up some volume based indicator to add in my tool box too. On Balance Volume (OBV) is developed long time ago, in year 1963 to show the money flow in and out in the market.
Volume is quite important in technical analysis. The volume is calculated in ticks movement in forex. But volume only shows increasing or decreasing on the change of ticks. OBV somehow gives direction to the volume. This will show buying or selling pressure.
The On Balance Volume Indicator
Calculation
OBV is calculated with the volume and price. OBV starts with 0. When a price is close higher, the volume of that bar is added into OBV. When the price closes lower, the volume is subtracted. Thus the number values in OBV have no significant meaning. What’s more important is the chart pattern and direction of OBV.
Healthy trend / Unhealthy trend
When uptrend occurs, a rising in OBV chart will shows that the trend is strong. This is because there are more volume that support the uptrend. When a downtrend occurs, a downtrend in OBV chart will show that the trend is strong.
Trading OBV trend-line
Trend line can be drawn on OBV, the same way that they are drawn in price chart. Traders look at OBV trend line because they believe in the concept “volume precede price”. Short and long signal are trigger once the trend line are broken. This is the same method use in trend line trading, once of the simplest form of trading.
Divergence
Divergence in OBV shows the trend is weakening. This is same method use when looking at other indicators.
Read more!
Tuesday 3 August 2010
Is Forex trading = Gambling?
I don’t think so. Many say trading in forex is like gambling, I don’t think so. But after observing the market, I starting to think it might be true? The market will move whatever way it wants. The technical indicators can’t predict the market movement. Maybe 40% of the times technical indicators are right about the movement. The market will give a sudden move on which ever direction it wants. The fundamental indicators and news not doing much better also, many times the market will move in another direction despite the news saying otherwise. But trading forex is not like gambling. In gambling, the statistic is on the house side, no matter which game. The house always wins. However in forex trading we can turn the statistic to our side. This is where Money Management and Risk control comes in. Proper risk management can decrease our loss. When I first learning I do not know the importance of these steps. After some times I finally understand why the most important is not our enter / exit strategy, but is our money management and risk control.
Read more!
Monday 2 August 2010
Basic: Volume
Volume and price are the 2 purest forms of data in technical analysis. All other indicators are based mostly on price and some on volumes. Unlike the share market, where each share traded is considered to be 1 volume, the volume in forex is calculated differently. This is because forex doesn’t have a centralized exchange, thus the calculation is different.
In forex, the volume is calculated by the amount of movement in the price. The movements are known as ticks. Thus the ticks movement represents a number in volume. Volume in forex measures the “worth” of the market move. Movement that backed by high volume are more significant. There is a saying that says “volume precedes price”, where volume is consider leading indicator.
Healthy Trend & Unhealthy Trend
A healthy trend is a trend backed up by increasing volume data. In an uptrend, an increasing in volume while the trend is moving up is considered a healthy trend. In a downtrend, an increasing in volume while trend is moving down is healthy trend.
A trend with decreasing volume is indication that the trend is weakening. Example in and uptrend, when the volume starts decreasing, the top is near, and the trend might starts to move sideway or reversal soon.
Accumulation
Accumulation is where the bulls take control of the game. In a down trend, accumulation happens when the price start moving sideway (or start moving up slightly), with the pick up on volume. After that reversal is possibly going to happens soon.
Distribution
Distribution is terms to describe the bears take control of the game. In an up trend, distribution is where the trend starts moving sideway (or slightly moving down) with increasing volume. After that reversal is most probably going to happens.
Volume spike and reversal
Area with more volume can be observed as significant support/resistance area. When many volume spikes appear in an area, it is possible that reversal is going to happens. A single spike on the other hand might be caused of news announcement.
Volume and breakout
Volume data can be used to confirm a breakout. Breakout is where the chart starts to move after some chart pattern formation. A breakout with low volume might be fake breakout. A breakout with large volume is more significant, and price is likely to move to targeted profit level.
Volume Based Indicator
Volume based indicator are less common than price based indicators. Here are some more popular volume based indicators.
- Volume bar on the chart on MT4
- Volume
- Money Flow Index
- Market Facilitation Index
- On Balance Volume
- Accumulation / Distribution
Read more!
Subscribe to:
Posts (Atom)