When I first learn Forex, I saw this word everywhere. Divergence and convergence in almost every article I read. But I not pay much attention to it. Later on I learn that regular-divergence and hidden-divergence can be important part on our trading strategy. Here I will share what I know about divergence.
Indicators are derives from price (and sometimes volume). They usually follow the direction of the price. Divergence is the phenomena where price is making a trend, but the indicators go opposite direction of the trend. The indicator signal “diverge” from the price, thus come the name. There are 2 types of divergence, regular divergence and hidden divergence. Divergence can spotted on any indicators, some fine examples are MACD, RSI, stochastic, etc.
Regular divergence usually shows the trend might be weakening and reversal is near. Hidden divergence usually shows that there is temporary retrace happening, and the trend might continue moving back to the main direction.
Regular bearish divergence
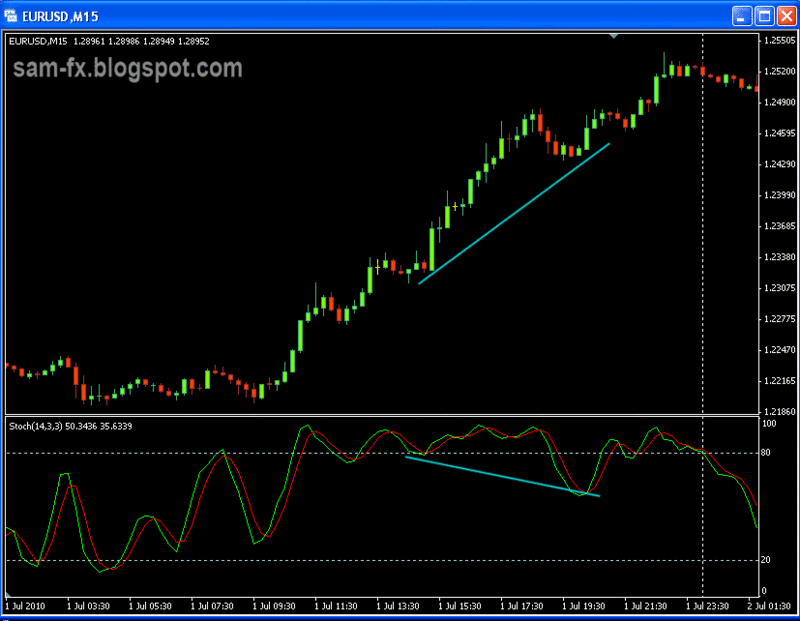
When price moving on an uptrend, the price is making a series of higher high. On the same time, the indicator will be making a series of lower high. This is regular bearish divergence. This show the bulls are weakening and the bears might take over soon in price reversal.
Regular bullish divergence
In downtrend, the price is making series of lower low. But the indicator will be making a series of higher low. This is sign of regular bullish divergence. This usually indicates that the bears are weakening, and the bull will starts to take over soon on price reversal.
Hidden bullish divergence
On an uptrend, the price is making a series of higher lows, however lower lows are shown in indicator. This is sign of hidden bullish divergence. This means that the dip are just a pause and price will continue to move in the same way.
Hidden bearish divergence
On a downtrend, the price will be making a series of lower high, however the indicators will show higher high. This is hidden bearish divergence. This shows that the recent high is just a pause, and the price will continue moving the same direction.
Lets loo at some examples:
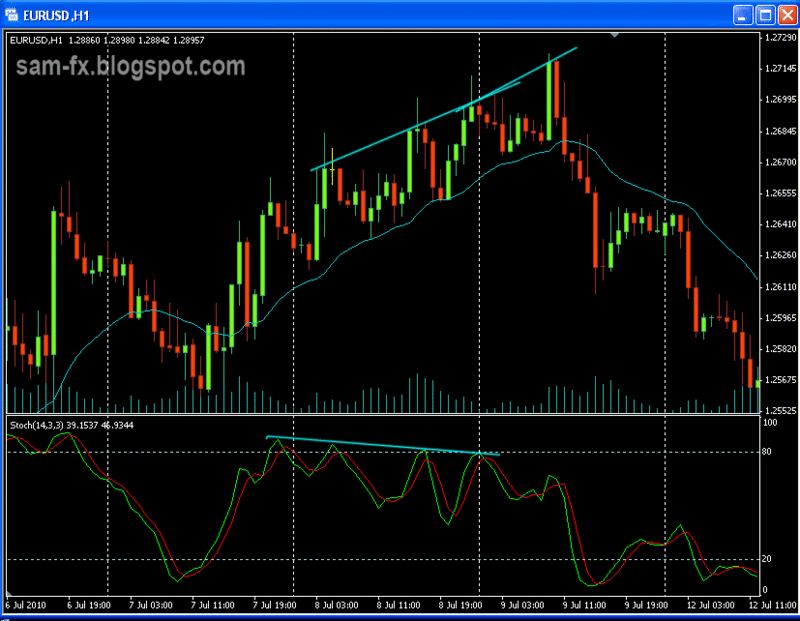
Regular bearish divergence. Price making higher high but indicator shows lower high.
Notice soon after bearish divergence appear, the reversal happens.
Notice soon after bearish divergence appear, the reversal happens.
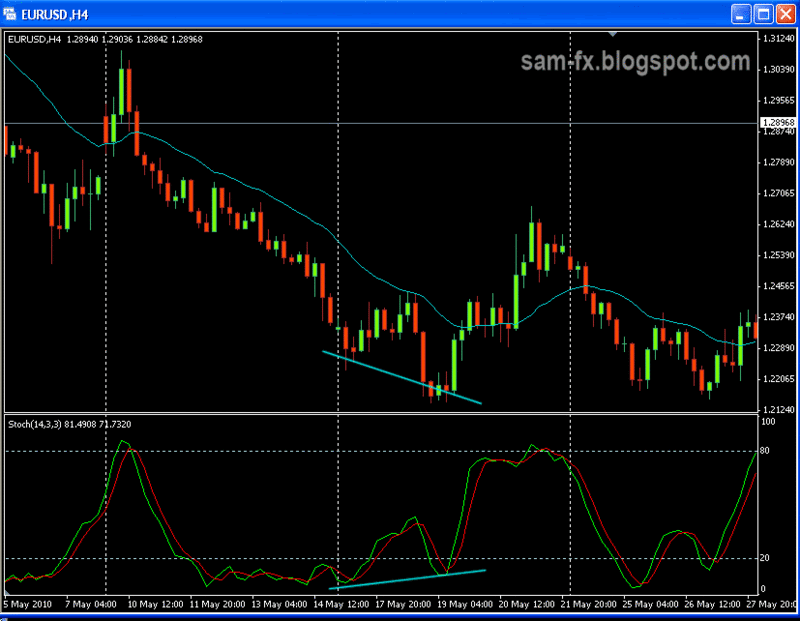
Regular bullish divergence. Price making lower low, indicator making higher low.
Notice that the reversal happens soon after the divergence.
Notice that the reversal happens soon after the divergence.
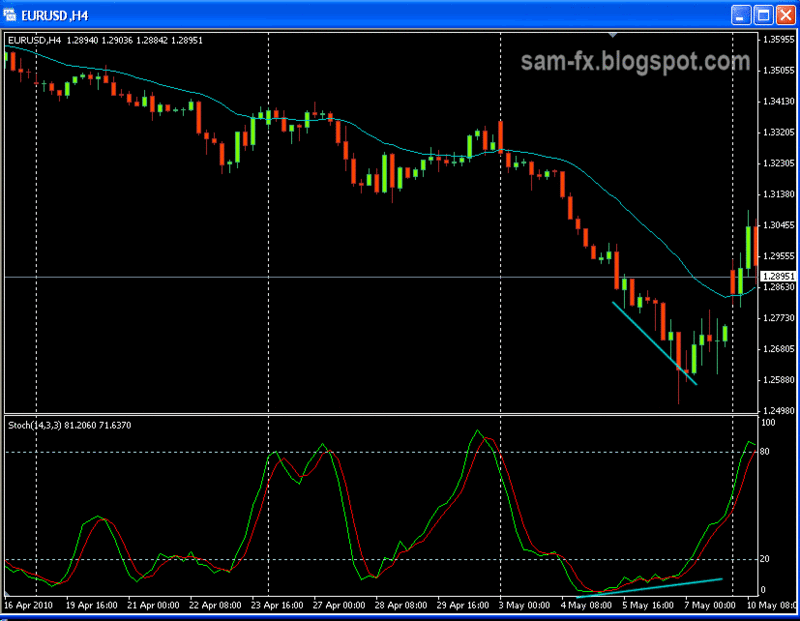
Another classic bullish divergence. Price making lower low, indicator making higher low.
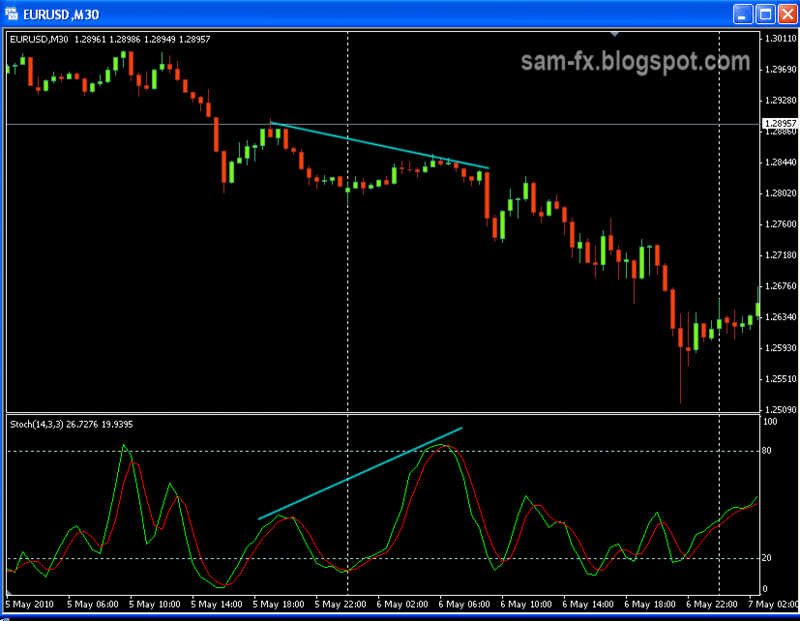
A hidden bearish divergence. Price moving down making lower high. Indicator making higher high.
Price continues to move in the same direction after the hidden divergence.
Price continues to move in the same direction after the hidden divergence.
A hidden bullish divergence. Price moving up making higher low. Indicator showing lower low.
Price continue moving in the same direction after the divergence.
Price continue moving in the same direction after the divergence.
Although divergence is not a 100% confirmation on reversal (or continuation), but it is a good indicator to watch out for. With combination on candle stick pattern and other indicators, this can create a very profitable trade.

