ADX stands for Average Directional Index. In short, this indicator shows the strength of the trend. ADX is developed by J. Welles Wilder to determine the strength of the trend. Here I would share more about ADX.
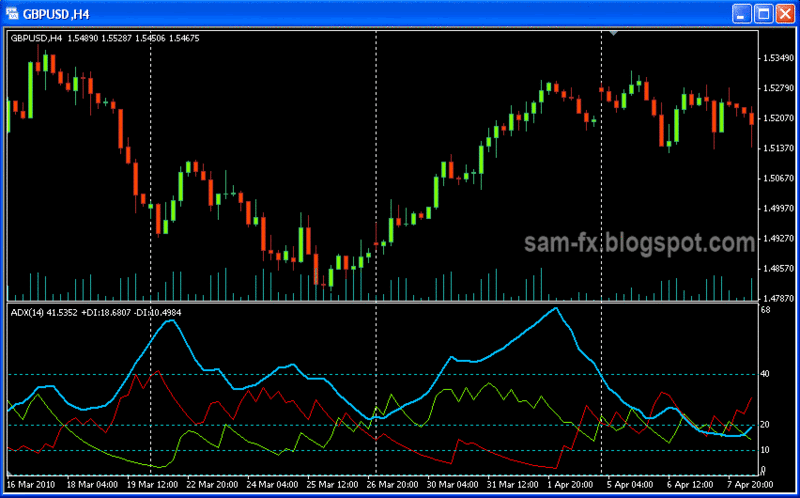
This is how ADX Indicator looks like.
ADX consist of 3 lines: ADX line, +DI and –DI lines. ADX signal will oscillate between 0 and 100. The main ADX line shows the strength of the trend. It does not show is it uptrend or downtrend. The higher the reading is, the stronger the trend. A general rules-of-thumb says ADX reading above 20 shows trending market, where reading below 20 shows ranging market. ADX above 40 shows a very strong trend. The ADX default period is 14. This means it is calculated with 14 previous bars in the chart. However the value can be lower or increase based on personal preference.
The 2 lines in ADX is +DI and –DI. They represent the strength of bulls and bears. They are the positive/negative directional indicators. When +DI is above –DI, the bull is on the upper hand. When +DI is rising, the uptrend is getting stronger. When –DI is above, the bears are stronger. When –DI is rising, this shows the downtrend is gaining strength. The +DI and –DI crossover can be seen as one side is overpowering the other side.
There are many use of ADX. The first is to determine the strength of the trend. Another way of using it is to use the DI line crossover to determine the turn of the trend. And ADX can be referred to determine if the market is ranging or trending; and in that way helping us to decide to refer to momentum indicator or oscillator indicator. Trend line can be drawn on ADX peak to show increasing or decreasing of overall momentum.
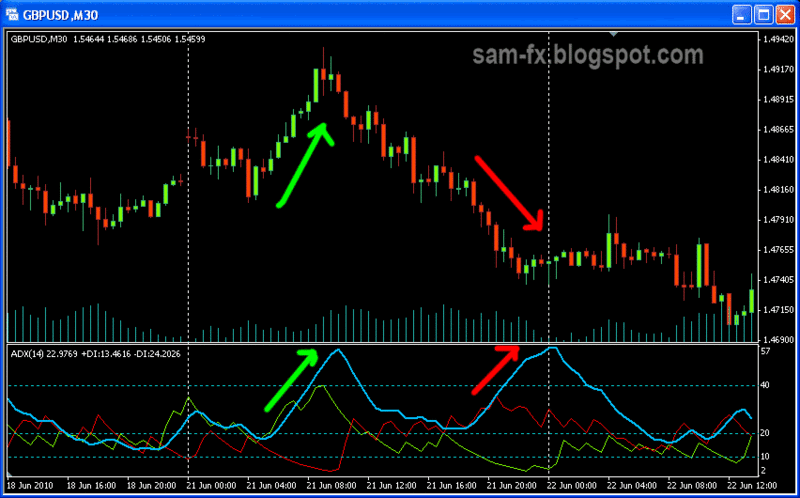
Notice in the picture above, when trend is getting stronger, ADX is rising, no matter its uptrend or downtrend
The ADX formula is beyond discussion of this article. A good source to find the ADX formula is on this page: http://forex-indicators.net/adx
In short, here are some guidelines on using the ADX
- When the ADX is over 20, the trend is strong
- When the ADX is over 40, the trend is extreme
- When the ADX is below 20, the market is ranging
- When the +DI cross above –DI, the bulls are stronger. Uptrend is taking place
- When the +DI is rising, the uptrend getting stronger
- When the +DI is moving down, the uptrend getting weaker
- When the –DI cross above the +DI, the bear are stronger. Downtrend is taking place
- When the –DI is rising, the downtrend is getting stronger
- When the –DI is moving down, the downtrend is getting weaker
- Trend line drawn on the peak of ADX can indicate weakening of overall trend.
- Trend line drawn on the lows of ADX can indicate increasing strength of overall trend


