A candlestick, similar to a bar chart, represents OHLC (Opens, high, low, close). Below is illustration of the candle stick.
 The top part and the bottom part is called the “wick”, or “shadow”. The very top and very bottom represents the high and low during the period.
The wide part in the middle is her “body”. The body is between the open and close price. Candlestick may have different color body, or hollow/solid body to represents higher opens, lower close, or lower opens, higher close.
At a glance of series of candlesticks with their different colors and size, it can give a good picture of how the price behaves. Candlestick with different body size and different shadow size will give a clue on the price movements too.
The Doji (どじ)
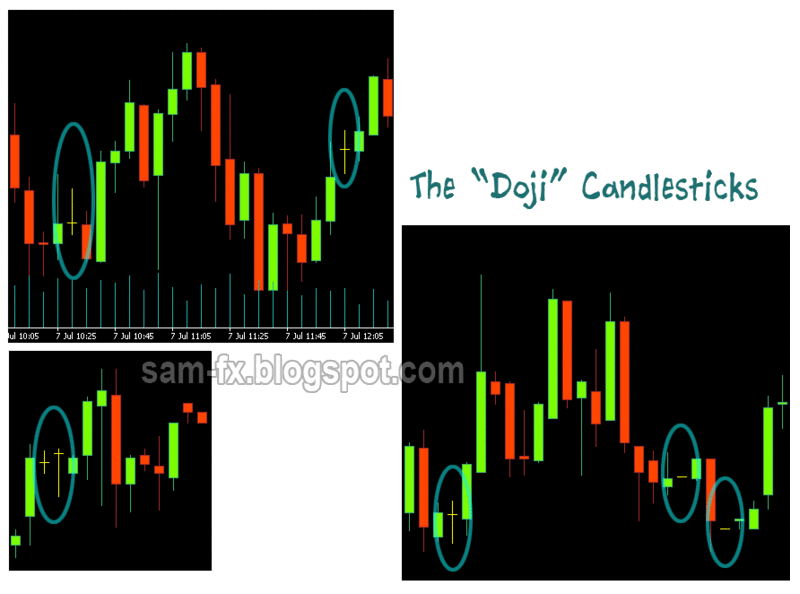
This is one of the most significant candlestick patterns around. Basically it’s a candlestick where the open and close prices are the same. Usually they are in the form of “+”. But they could be a form of “-“(no price movement at all);
“T” (same open and close, with lower price movement in between, “dragonfly doji”);
“_|_” (same open and close, with higher price movement in between, “gravestone doji”);
Below are some “Doji” I screencaptured from my charting software.

Many articles saying that Doji appeared will represents reversal is near. From my experience this is true sometimes. The Doji might mean continuation too. What I usually do is waiting for the next candle to close to make my judgment. The Doji appear after a rally meaning that one side of the bulls/bears are exhausted, it might means a reversal (the other side power up), or it might means a continuation too (taking a pause). The way to be sure is to wait for next candle close to confirm it.
