Bollinger bands, a nice indicator developed by Mr. John Bollinger in the 80s. This is among the most used indicators in stock market and also in Forex market. It is one of the best indicators to measure market volatility and trend. Although I have not much experience in Bollinger band, I would like to write about it here, since I just study some details lately.
Bollinger band is series of 3 lines. The middle of the band is actually simple moving average. Mr. Bollinger recommend that using 20 as the period for the SMA. The upper and lower line is actually standard diviations from the SMA. Around 80% of the time the price will move around within the upper and lower band (with deviation of 2), as if a ball bouncing within the 2 wall.
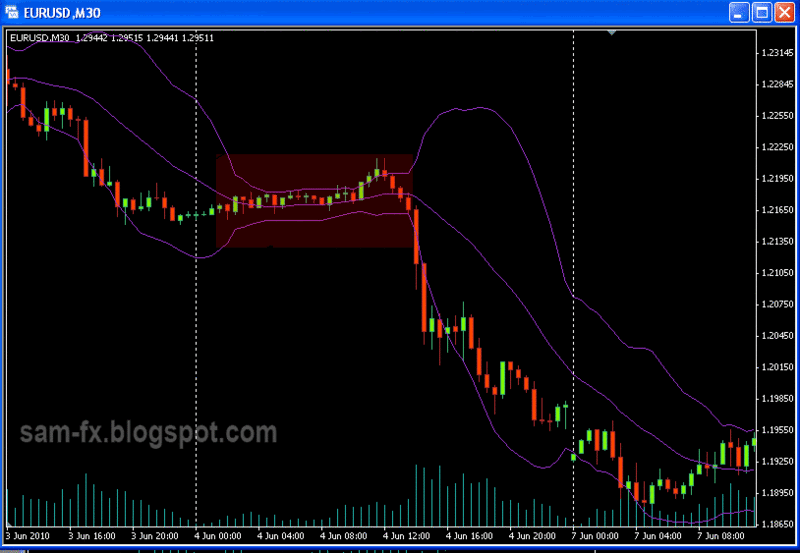
Photo above is bollinger band, with deviation of 20.
Market volatility
The Bollinger band gives picture of market volatility at a glance. When the 2 bands are future from each other, the market is more volatile. When the 2 band are getting closer to each other, the market tends to be less volatile.
Overbought / oversold (Bollinger band reversal)
When price reach the upper band, it is said being overbought; and when price reach the lower band, it is said being oversold. Most of the time price tends to bounce within the 2 bands.
Many traders use this as buy/sell signal: going long when price touch or penetrate lower band; going short when price touch the upper band. Some might even doing very well with this method, as 75% of the time the market is ranging. The price tends to move between the 2 bands when market is ranging.
However this would be a bad method at trending period. As Mr. John Bollinger points out, many times the price will "Rides the band". ("tags of the bands are just that - tags, not signals. A tag of the upper Bollinger band is not in and of itself a sell signal. A tag of
the lower Bollinger band is not in and of itself a buy signal". Price often can and does "walk the band")
So to use the "bouncing" method, confirmations from other indicator are necessary. Usually combination with another momentum indicator (e.g. RSI, stochastic) makes a good confirmation.
This works best in ranging market. The Bollinger band tends to work as mini supports and resistance area for the price.
Notice on the chart above, the price tends to bounce between the 2 band before breakout
Breakout (Bollinger band squeeze )
When the Bollinger band contract or squeezed, a breakout often occur after. This happens when market went through low volatility period when the bulls and bears are competing, and when 1 side takes over, the move tends to be big.
Usually when price starts to break above the band, it will continue it move upward and vice versa for lower breakout.
A breakout occur after bollinger squeeze (red area).
Another breakout and continuation occur (green area) after Bollinger Squeeze (red area)
Strong trend (Bollinger band continuation)
On strong trend, the price most often wont 'bounce' on the Bollinger band; but continue to move along side the band. It is important to identify is there high possibility for a bounce or continuation.
When price breaks the upper band, if the upper band is pointing upward in the same time, there are high possibility continuation is happening. Price is more likely to continue to move upwards.
When the price breaks the lower band, if the lower band is also pointing downward, there are high possibility continuation is happening. Price is more likely to continue to move down.
Changing the Bollinger Band period
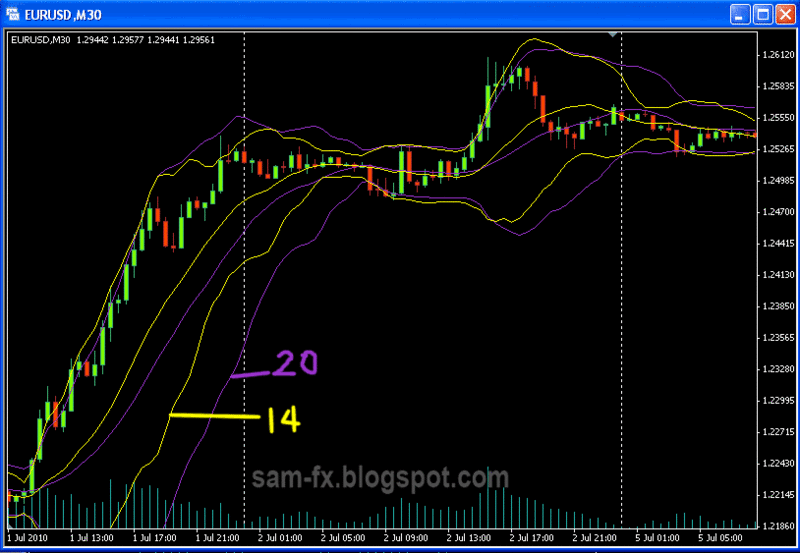
The period (default 20) can be change based on different types of markets. 2 most popular periods is 20 and 14. On less volatile market, lower the period can makes movement easier to identify. A period that is too short will give more false signal. Bollinger band with longer period will appear wider than the shorter period Bollinger band.
Bollinger band with period of 14 (yellow) versus period 20 (purple)
Multiple bands
Multiple sets of Bollinger Band can be used together to give different meaning. There are many trading methods that involve multiple Bollinger Bands.
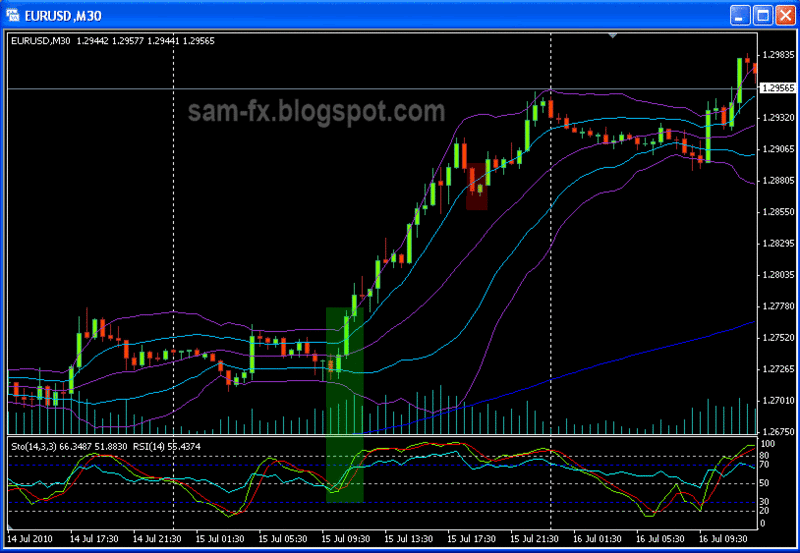
In example below, 2 sets of Bollinger Band is used, one with 1 as deviation and another is 2 as deviation. The area outside Bollinger band 1 and inside Bollinger band 2 is considered as buy/sell zone.
When price move inside Bollinger band 1 it is good exit signal.
Using 2 Bollinger Band; when the first breakout occur, confirm with Stochastic and enter the market (green area). When the price close inside Bollinger 1, exit is trigger (red area)
Above is what I have learnt about the Bollinger Band. Please feel free to post in your comments and opinions.


