
MacDonald? Oh we are not talking about fast food here. (But thinking about their burger makes me feel hungry while typing this.) Yeah, MacDonald, is called MAC D in short form in my countries, with many advertisement saying/singing "macd"... Too off the topic I guess, in
this post I would like to talk about MACD indicators, developed by Gerald Appel.
MACD stands for Moving Average Convergence Divergence. As the name implies, it show the Convergence and Divergence of 2 moving average. Its one of the most used technical indicators out there. What make MACD so good is that it shows the convergence and divergence in once glance. Beside that the oscillation of MACD signal line can show
convergence and divergence between itself and the price too.
Let’s looks at what makes out the MACD indicators. The default value would be “12, 26, 9”, which is 12 EMA of the price chart, 26 EMA of the price chart, and 9EMA of the MACD signal. The value 12, 26, 9 can be changed to other value to suits your trading needs. For me I would stick to the default.
In general, MACD indicator will consist of the following:
- ”Fast line”, or sometime called “MACD”; which is difference between 12 EMA and 26 EMA on the price chart
- “Slow line”, or sometimes called “signal line”; which is 9 EMA of the MACD (a.k.a. “fast line”)
- Histogram: the difference between the fast line and slow line.
Reference:
babypips.com (http://www.babypips.com/school/macd.html )
ivestopedia.com (http://www.investopedia.com/terms/m/macd.asp)
incrediblecharts.com (http://www.incrediblecharts.com/indicators/macd.php )
stockcharts.com (http://stockcharts.com/school /doku.php?id=chart_school:technical_indicators:moving_average_conve )
What makes beginner like me confuse is that different article talk about MACD in slightly different form. Some of it with histogram, some of it doesn’t, some with different lines, etc.
To add on to the confusion for beginner like me, the default MACD inside Metatrader is totally difference from the source above. In MetaTrader, the MACD consist of
- “signal line”, which is 9EMA of MACD
- Histogram, which represents the difference between 12 EMA and 26 EMA on the price chart
Yes, I was pretty confused last time. Then I notice that all those difference, they all don’t matter. The default MACD in Metatrader can be as efficient as other variant of MACD out there. Let me describe how to use MACD here without worrying about all the variants. First let’s load up the default MACD in our Metatrader. It looks totally different from the MACD we saw on different articles. With some studies I found out what that histogram represents. Refer to the screen capture below on my chart; I have plotted out 12 EMA and 26 EMA on the price chart.
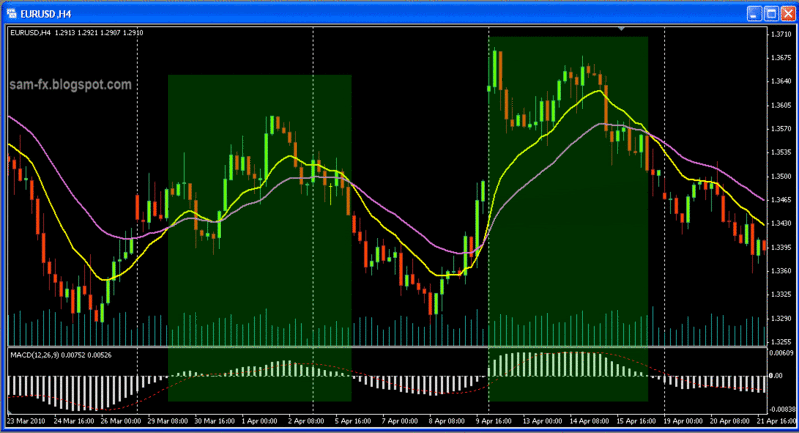
MT4 MACD, with 12EMA (yellow) and 26 EMA (purple)
Notice that when the 12 EMA (yellow) and 26 EMA (purple) diverge (separate) from each other, the histogram goes longer. Notice when 12 EMA is above 26 EMA, the histogram goes above the 0 line (I have mark it in green box); and when 12 EMA cross below the 26 EMA, the histogram goes below the 0 line. In Metatrader, the histogram replaces the traditional MACD line. Now let’s look at below to see how to spot a “MACD crossover”
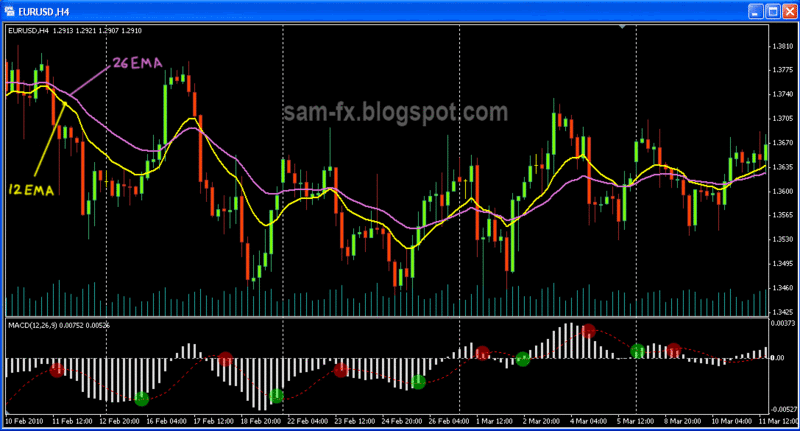
Spot for MACD crossover (red and green circle) on MT4 default MACD
In traditional MACD graph, the crossover happens when MACD cross the signal line (9 EMA of itself). Since the Metatrader default MACD is replaced with histogram, we will spot the crossover when the line crosses the histogram. On the above screen, I have mark the cross with green and red circles. The Screen below shows the different between traditional MACD graph (bottom indicator window) and Metatrader MACD graph.
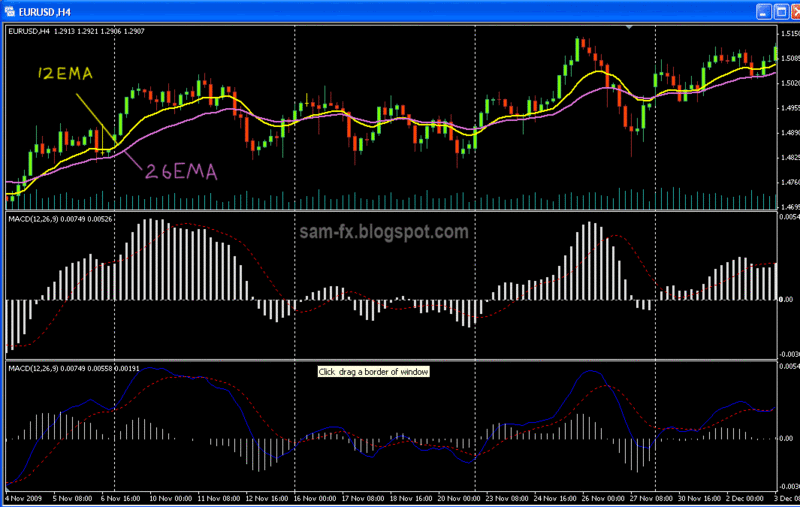
Difference between MT4 default MACD and a 'traditional' MACD (below)
I have mark out some of the point when look at a traditional MACD indicator and Metatrader MACD indicator. Here are few points to take note:
- When look for MACD signal line cross, in MT4, we look for the line cross the histogram (red and green circle)
- when look for 12 and 26 EMA cross, in traditional MACD, we look for MACD signal to cross the zero line; in MT4, we look for histogram to cross the zero line. (blue circle)
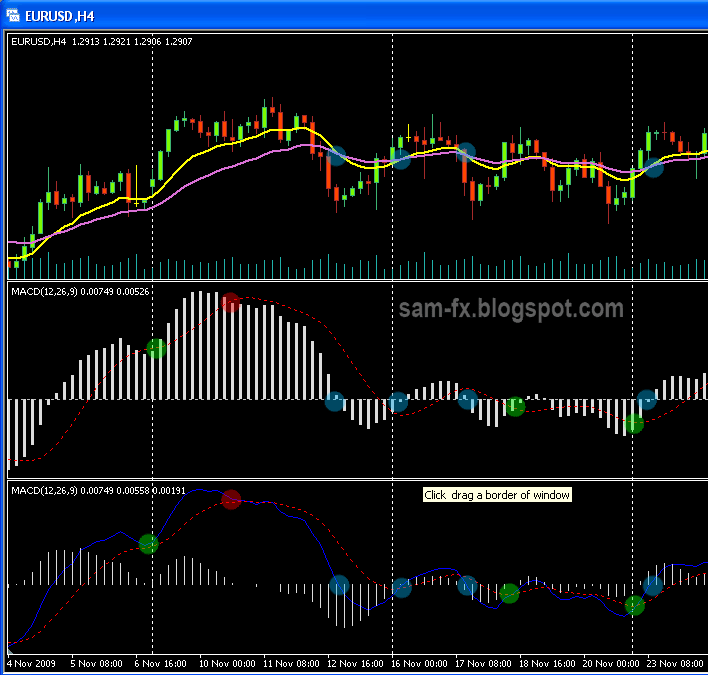
Spot the crossover in different MACD indicators
Here are some tips on using the MACD indicators:
- when the fast line cross below the slow line, and start diverging, it shows strong bearish sign
- when the fast line cross above the slow line, and start diverging, it shows strong bullish sign
- when MACD is positive and rising it means increasing acceleration of the uptrend
- when MACD is negative and decreasing it means increasing acceleration of downtrend
- when MACD moving above positive, in the same time the fast line is above slow line, its bullish signal
- when MACD move below positive, in the same time fast line fall below slow line, its bearish signal
- when MACD and price are diverging, reversal maybe is near (when price reach a new height but MACD show lower height; when price hit a new low but MACD shows a higher low)
- when MACD rises or decrease dramatically, its said that its
- overbought/ oversold, we should be careful of retrace
Trade with above tips, and you will loose money. What I meant is MACD is not to be used alone. Used it with your price pattern and other indicators, and you will have a profitable trade.
There you go, some details on MACD and also MT4 default MACD. Let us start trading with our favourite MACD setting.