Showing posts with label forex trading. Show all posts

Tuesday, 16 November 2010

Trailing Stops in Metatrader

I have been testing out trailing stops feature on Metatrader lately. In this posting I will talk more about this wonderful feature. Also attach here are some of my trailing stops result.


To use the trailing stop on your Metatrader, right-click on your opened trade (inside terminal window), and select trailing stop, then select the amount you need. By default there are pre-determine points, but you may enter your own value as trailing stops.

When the price move more than the amount from your entry (or your previous stops), Metatrader will automatically set new stops. Because trailing stops is executed with the MetaTrader client, thus the client has to be left running to enable the trailing stops.

I have been trying with various value for trailing stops. Set the value too small, and the trailing stops will move according to price, but we will get stop out at slight retrace of the price. This is not good as the price will continue to move a great deal after the retracement.

If setting the trailing stops too big, we might miss out some trade, some winning trade may be too small to move the trailing stops, and reverse out and cause losses.

I still have not find the suitable value on each timeframe yet. Will be working out ways to optimized it.

Read more!

Friday, 12 November 2010

Indicator: ZigZag Indicator

The zigzag indicator is not really an indicator. It is used to illustrate the price trend in clear form, filter out less significant price change and noise.


Zigzag indicator using percentage of difference in its construction. When a swing low or high is more than the percentage, the line is drawn. Other swings high or low that are smaller than the percentage of changes are ignored. The ZigZag indicator did not have predictive power.


Usage
Zigzag indicator used to highlight the trend. It can be used to determine the direction of trend. It however does not indicate timing for entry and exit. The line is redrawn based on changes of the price.

Another use of ZigZag indicator is to ease the wave count. Many traders use zigzag indicator to count the wave in Elliott Wave form.

Here are some reference on ZigZag indicator:
http://www.forexrealm.com/technical-analysis/technical-indicators/zig-zag.html
http://www.traderslog.com/zig-zag-indicator/
http://stockcharts.com/school/doku.php?id=chart_school:technical_indicators:zigzag

Read more!

Thursday, 30 September 2010

ATR Indicator

ATR stands for Average True Range. This is another famous indicator developed by J. Welles Wilder. In short, this indicator indicates the volatility of the market at particular time. This is not a directional indicator; it does not indicate the direction of the prices. Lets look into more details below.


What is a true range?
Wilder quantify the volatility of the market with true range. A true range is the greatest among the following 3 items.
  • Current high minus current low.
  • Current high minus previous close.
  • Current low minus previous close.

The true range is always positive number. From the calculation above, we know that the true range (volatility) will increase when: there is long candle, or when there are big gap between candles.


Average True Range.
Average True Range is the moving average of True Range. Usually the period is set as 14 for 14 moving average of the true range. The other favorite number is 21. The number can be customized to meet the trading needs.


Using ATR
ATR can is an indicator for market volatility. The value in ATR has no real meaning, because it is relative to each other. Some pairs will have larger value than other. Some use low ATR value to predict possible turning point of the price, however this is not always accurate.

Another way to use ATR is using it to set stops. This is because we need wider stops when the market volatility is high; and we can set narrow stops when the market volatility is low. Usually we can set stops based on 2 to 4 times of ATR value.

Another way to use ATR is avoid whipsaw. If we trading breakout, usually we enter once breakout occur, however whipsaws can occur too. By using ATR, we enter on breakout plus 20%ATR, this will give some filter against whipsaw.


To learn more about ATR, here are 2 websites that have more detailed information:

Read more!

Monday, 27 September 2010

Currency Trader Magazine.

I stumble across this magazine lately, and I must say this is a very comprehensive magazine. Currency Trader Magazine, published monthly, and each issue is around 50 pages. This is magazine that is specifically for Forex Traders. Best of all, this magazine is free, you can get the latest issue each month for free. To get your copy of Currency Trader Magazine, please visit http://www.currencytradermag.com.


Read more!

Friday, 24 September 2010

ECN broker vs. Market Maker Broker

I learn this couple of days ago. This is one interesting fact to consider when choosing broker. I share it here some information I have learned. Because forex market is not regulated, the rate and spread is difference between different brokers; unlike stock market where there is central exchange for the trading to take place.


Market Maker Broker
As the name implies, Market Maker set the price of the market. They set their own Bid and Ask value. These brokers earn from spread (difference between bid and ask price). They usually fix their own spread. Some broker may show different spread on demo account and live account. There are speculation that Market Makers create spikes to take out customer's stops. During times when volatility is high, these brokers might freeze their platform or increase the spread a lot. Lately there are many competitors and usually the spread are keep very competitive.

The advantages of these brokers are they usually required less capital to open an account. Usually the offer higher leverage too (this could be a disadvantage too). Another advantage is that they usually offer more user friendly trading platform.


ECN Brokers
ECN stands for Electronic Communication Network. These brokers pass on price from multiple participants, such as banks, market makers, as well as traders. They will display the best price straight from the market. There are no manipulation of price and also the spread. Usually spread will be varying from time to time. Sometimes there might even be no spread for the traded pair. ECN brokers earn from commission. They charge commission from each trade their customer made.

The biggest advantage on ECN is there are no manipulation on price and spread. On some times, the spread might even be zero. Their price also might be more volatile, and this seems like good news for scalper.

One disadvantage of ECN broker is lack of user friendly platform. Another disadvantage is there is commission for each trade; however this might be better than having a spread that being manipulated. Another point about ECN is they need more capital to setup account.


Above are few items I learn about ECN and Money Maker brokers. Different traders might choose their own type of brokers based on the pro and cons.Read about Dealing Desk, Non-Dealing Desk, STP and ECN brokers here at http://www.100forexbrokers.com/stp-ecn-brokers. Read about difference on Market Makers and ECN broker here, on Investopedia: http://www.investopedia.com/articles/forex/06/ECNmarketmaker.asp

Read more!

Tuesday, 21 September 2010

Metatrader eating up your harddisk space?

Help! Metatrader is eating up my harddisk space! Recently I notice my harddisk running low after few round of backtesting. After some investigation I found out where is the un-used data is gather at. Since there are very less article on the www talking about this, I thought I would share it here.


After running few back test, I notice the data is gather around “tester” folder. This is at /tester/history; in my case, it’s in C:\Program Files\MetaTrader 4\tester\history. I not sure what the file is used for, but they appear after back test. So I suppose this is back-test data. Some can be as large as few gb. Deleting them after back test can free up lots of harddisk spaces.

Read more!

Friday, 17 September 2010

tutorial: History data in Metatrader

Accurate data is important on backtestting. I noticed that there are not much tutorial on backtest in MT4. Here I will share about downloading historical data into MT4. These are some information I have lately. Feel free to drop me a comments if I have missed out smoething.


Historical data can be downloaded through MT4, or external source. I not yet found a source to download the data, so I do it through MT4 platform.

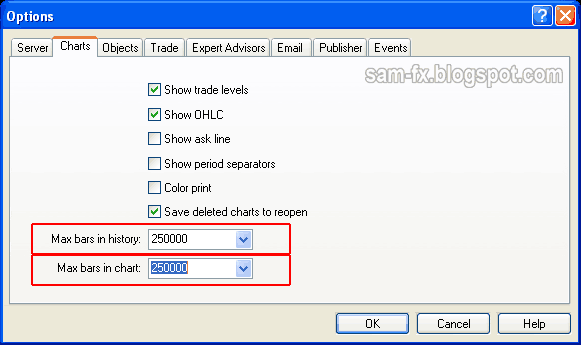
First you need to set the Maximum bar display in chart. Go to “tools”, “options”, then select the “Chart” tab. This option is to set how many bars to keep in history. This will affect how many data you can download. But set it to too high, and you may experience lag in your computer. 


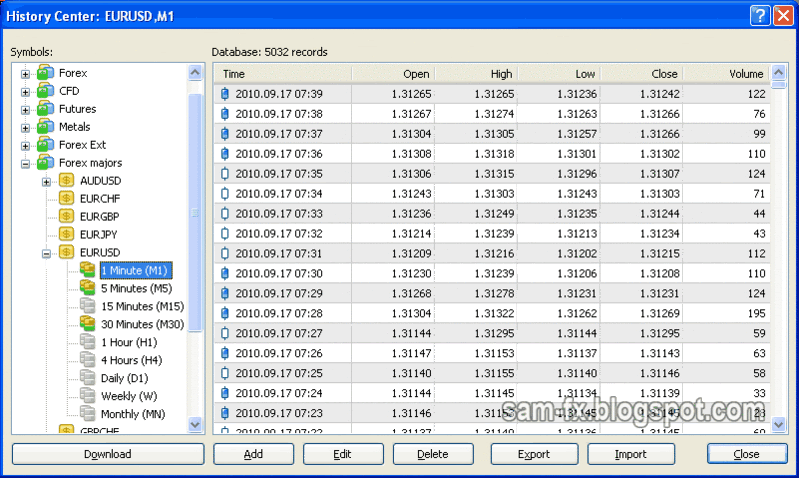
After changing the setting, to go history center. It Is at “tools” , “History Center”, or you can press “F2” key. When it is open, you can see the history center window like below. Double click on the pairs you want the history, then double click on the time frame you like. Usually I would chose “M1” and “M5”. After that, click “Download” button below. There might be warning message appearing, click “OK” to continue.


After that all you need to do is wait for the download to complete. Then your history is ready. Now you can start doing your backtesting.

Read more!

Wednesday, 15 September 2010

My First EA

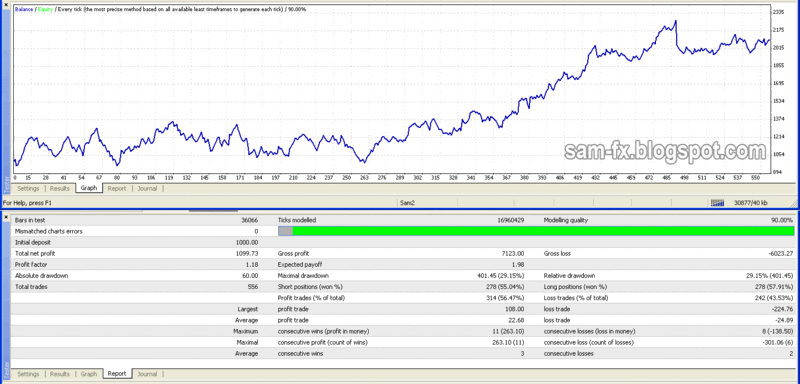
This is my first EA. I writing it based on simple Moving Average Cross system. Adding inside is my own money management rules. So far it tested out OK. Below is the results using data from 2008 to august 2010. Below is the screen capture of the EA tested from Jan 2008 to August 2010. The time frame I used for this back test is 15 minutes. I will post the EA for download soon.


Read more!

Tuesday, 14 September 2010

EA v.s. Manual trade

The past few days I have been studying on EA. Writing EA can automate our trade, and it can runs automatically all the time. This saves our time to monitor the screen. However E.A. is not perfect, so does human who does manual trade. I not sure what did the big player in forex market using (EA or manual trade?). My EA is not yet perfect. Here are some pros and cons I notice.


  • Human have emotion, these emotions can affect our trade (greed, fear, attached to the trade, guessing)
  • Human have guts feeling, this can lead to bad trade
  • Human cannot monitor the screen all the time, thus will missed out some trade.
  • Manual trade is time consuming
  • EA will perform faster than human (in certain condition, the price moves very fast)

  • E.A. is automated with a set of rules. Sometimes there might be exception
  • In different time human may have decision made based on different condition. EA will follow predefined rules
  • EA do not have guts feeling. Some traders with many years of screen time have more accurate guts feeling.

Read more!

Monday, 13 September 2010

A new sub-Chapter begins

All the while I have been study the technical analysis and also the fundamentals. Now is the beginning of a new sub-chapter. I am now studying scripting in MQL4. Surprisingly is not really that hard to learn (if you have programming background). The language is just like C language with some limitation. There is also many predefined variables and keywords to be caution about. I am now studying how to write my own EA. I will continue to update some tutorial here.

Read more!

My earning from swap interest

This is the largest amount I have earn from swap. The best part is this is all from 0.1 standard lots. Anyway this is only in demo account to test out few things. The screen capture below show the swap I earn, its even more than the profit itself. 


Read more!

Thursday, 9 September 2010

Where to set stop loss?

Lately I have this dilemma, where to set stop loss. If we trade sure we will set a stop loss, weather is predetermine, or set it in our mind. As the book “the true turtle” stated, they do not place their stop loss, but have a target in mind. When the target is hit, they will exit the trade.


Set it in mind
This could be the best; we can avoid our stops being hunt by the big players. But by doing so, we need to monitor the price all the time. To pull the trigger to exit takes big courage. Sometimes our emotion will get the better of us and is hard to exit the loss; this will result in greater loss.

Setting the stop closer
Set the stops closer to entry, each time we get stop out, we loose a little. However in this way we will get stop out more often. Placing stops closer to entry also increase the chance of being hunt by big players.

Setting the stop further
Setting the stop further will decrease the chances of them being hit. However having it further means each time it’s being hit, we will suffer greater loss.

Setting stops to previous high and low
These are the favorite place for everyone to put their stops. This also the easiest target for being hunt out by big player / brokers. Setting your stops near previous high/lows with a bit clearance still will be hunted out easily

Setting stops on previous resistance / support
These also few places that easy to be hunt out… giving it a little bit of padding also wont be much help, as price will comes to take your stops and move to your intended direction.


There’s no worse feeling than seeing your lost being hit, and then the price continue to move in your favor. Do you feel that the price purposely comes to hit your stop and than continue to move in the direction you predicted? Setting stops is like an art. I not yet master this art. Hope I can post a more helpful guide on stops in the future. Stay tuned.


Read more!

Wednesday, 8 September 2010

basic: RSI (part 2, more information)

Not long ago I have posted about the Relative Strength Index (RSI). In the post I have highlight some way to use this indicator. Recently I have found out a bit more information about RSI. Here I would like to share out the few more points I have learned.


RSI vs EMA, RSI period
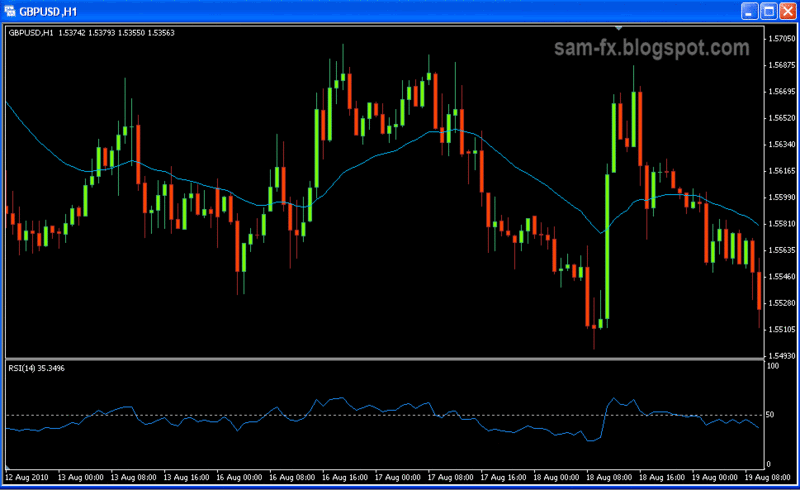
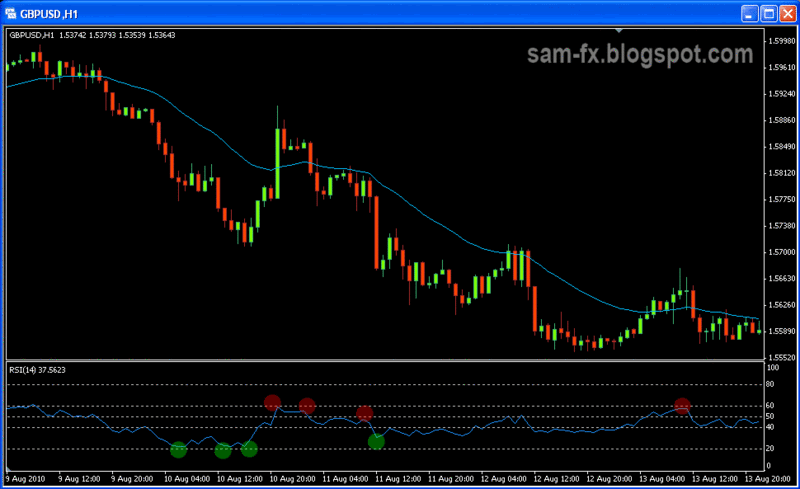
I read this in an article in Currency Traders. It is said that RSI is equivalent to EMA (Exponential Moving Average) two times the period of RSI. This is because the way RSI is being calculated. In the image below, I have plot out RSI 14 and EMA28. Notice that RSI will be below center line when the price is below EMA; and RSI will be above the center line when the price is above the EMA. 


The default value for RSI is 14. It is said that the best period for RSI will based on the price cycle divided by 2. If the price cycle is 28 period, than RSI 14 is recommended.


Trend determination
RSI is a momentum indicator; however it can be used to determine a trend too. I learn this from an article by John Hayden. Andrew Cardwell have studied and developed many new usages for RSI. Using RSI to determine trend is one of it.

In and uptrend market, when the price is trending, the RSI will find its support around level 40 and resistance around level 80. The RSI will makes higher lows and highs.

In a downtrend market, when price is trending, the RSI will find its support around level 20 and resistance around level 60. The RSI will make a lower lows and lower highs.

In the example below we have a down trending market, with RSI around level 60 and 20.


Divergence in RSI
I read this in the article by John Hayden. What shock me is this is absolutely opposite from what I read from typical textbook. And what surprise me more is he is absolutely right.

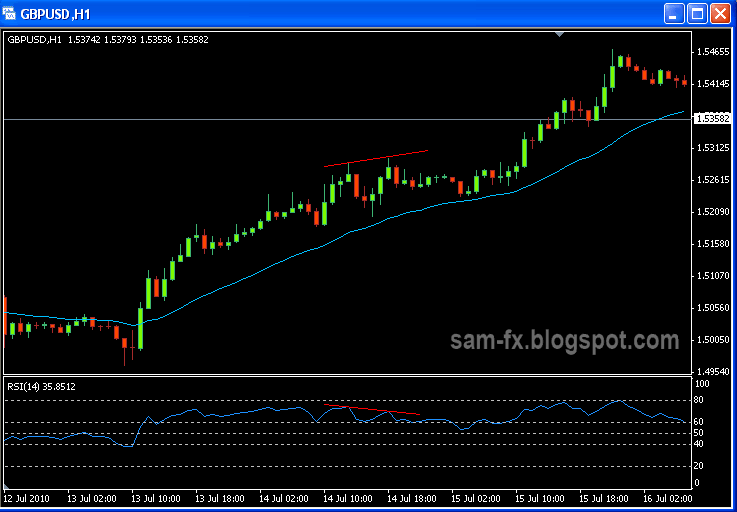
According to John, when bearish divergence happens in uptrend, he will think of Bull Market. In this situation he will be looking for opportunities to go long.

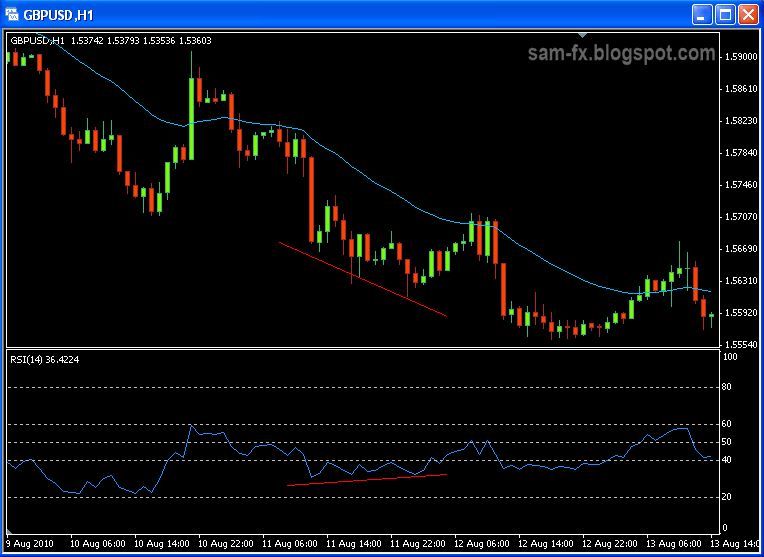
When bullish divergence happens in downtrend, he will think of bear market. In this situation he will be looking for opportunities to go short.

And this is very much correct. Below I have some few example of it.


Here you are, 3 pieces of important information for RSI. Use it wisely and it will bring more earning to you.

Read more!

Tuesday, 7 September 2010

trades: Missing another move at GU

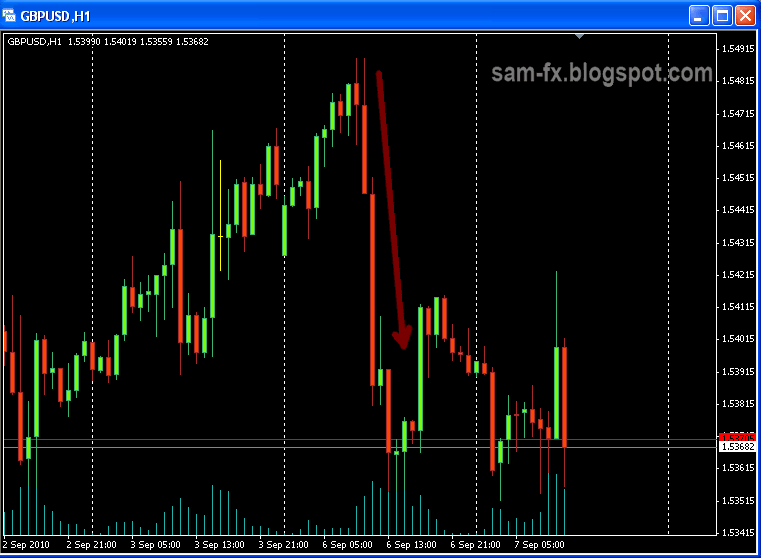
I have missed out this trade again. 06 September 2010, the GU is making a huge down move. No news or anything to amplify it; the price just move down like nobody business. My system manages to identify the move at beginning of the trend. As usual I am too busy at my day job to notice it. Too bad I have missed it, better luck next time. Below is the screen capture of the hourly chart.


Read more!

Friday, 3 September 2010

NFP... missed it again

I missed out the trade when us NFP ( Non Farm Payroll) comes out again. This only happens first Friday of each month. It's been 6 contiuous times I hav missed it. This time is all because the stupid internet connection having problem..

Read more!

Thursday, 2 September 2010

strategy: Rob Booker’s “Strategy 10”

The past few weeks I feel very much stressed out, and I don’t know why. It seems like all trades doesn’t went my way. This affected my eating and sleeping routine, and this is not good. Then this week I started following “strategy 10”. Surprisingly I feel relax, and happy. “Strategy 10” is not really a trading strategy; it is more to a disciplinary guide. This is the first ebook written by Rob Booker. Let’s see how this works.


“Strategy 10” is not really a trading strategy. There are no entry rules or indicators to follow. The “strategy 10” simply says that, we look for trade that could earn 10 pips. After 10 pips, we are out. We well not be looking at 100 pips trade. Each day we earn 10 pips and turn off the monitor. It takes some times to get used to it, but I think this is a good way to train our discipline too. Rob Booker did mention that we could trail our stops if the price moves our way, to capture more pips. So the rule is simple: Take 10 pips each day; turn off the monitor.

I not sure how real Rob Booker is as a trader (there are many people commented on the course he giving). But this “strategy 10” does help me be less tress; and trained my discipline in trading. To obtain a free copy of this ebook, you may visit Rob’s website at http://www.robbooker.com/

p.s. Just notice he keep facial hair since last time I visit… nice choice of style, I like it.. lol.


Read more!

Monday, 30 August 2010

tips: true value of a pair

I read this from a book, so I think I share here too. When the price of the pair is near to Moving Averages (example EMA), it is closer to its true value. When the pair is moving further from the MA, it is said that the pair is overpriced. The Moving average can be at any value. The closer the price to the Moving Average, the more value to the price. When price moving away from moving average, it is overprice; and when we bought overpriced pair, we hope for bigger fool to bought it too and make the price go further. So the conclusion is, when the price is closer to MA, the price is more worth the value.
Read more!

Friday, 27 August 2010

books: Getting Started in Forex Trading Strategy


I finish reading this book today while waiting for my friend for 2 hours. This is a book written by Michael Duane Archer. He is also the person that record down the famous “Goodman Swing Count System”. This book mainly focuses on technical analysis and codex strategy. It starts off by teaching us about market environment, wave system, and move on more detail on the strategy. Overall, this is a good book to read; and I admit I have learned a lot from it. Sold at MPH for around MYR35 at MPH (US$ 12 at Amazone), this is a bargain for a book too. If you like to have a preview of the book, you could click this link for Google Books.

Read more!

Thursday, 26 August 2010

basic: Bollinger Band (part II)

Not long ago I have posted about Bollinger band indicator. Lately I have come across some more facts about the Bollinger band in my reading. Here I would like to share with you some of the important points I have come across. Although personally I not yet use Bollinger Band in my trading system, there are no doubt this is a good indicator and many successful traders using it.


Here are some additional points about Bollinger Band.
  • Bollinger Band does not indicate buy or sell signals. It must be used in conjunction with other indicators.
  • Bollinger Band can use to clarify the double tops/double bottoms pattern (“M” and “W” pattern)
  • Close outside the Band usually indicates continuation pattern, and not reversal.
  • The center line of Bollinger Band is SMA
  • If the length of SMA being increase, the deviation should be increased. E.g. 20 period with 2-deviation, 50 period with 2.5 deviation.
  • Touching the band dose not indicate sell or buy signal. Touching the band is useless information without confirmation with other indicators.
  • New high/low outside the band follow by another high/low inside the band indicates highly chances of reversal.
  • When double-bottoms are formed, a buy signal is indicated when first bottom penetrate the band and the second bottom remain above the band. The bottoms can be higher or lower than each other in any way.
  • When double-tops are formed, a sell signal is indicated when first top penetrate outside and the second peak is below the upper band.
  • A breakout is highly going to happened after Bollinger-squeeze. Bollinger band does not indicate the direction of the breakout.
  • Using divergence and hidden-divergence can get higher probably of the breakout direction after Bollinger-squeeze.
  • Bollinger Band period can be fine tuned to match your price. In a reversal in downtrend, the price needs to form a higher second low-point. The Band should hold support for second low. If the second low penetrates the band, the period can be increase. Same goes for the uptrend reversal.


The above are little information I manage to learn yesterday. Hope this is useful for you all.

Read more!

Wednesday, 25 August 2010

A day scalping

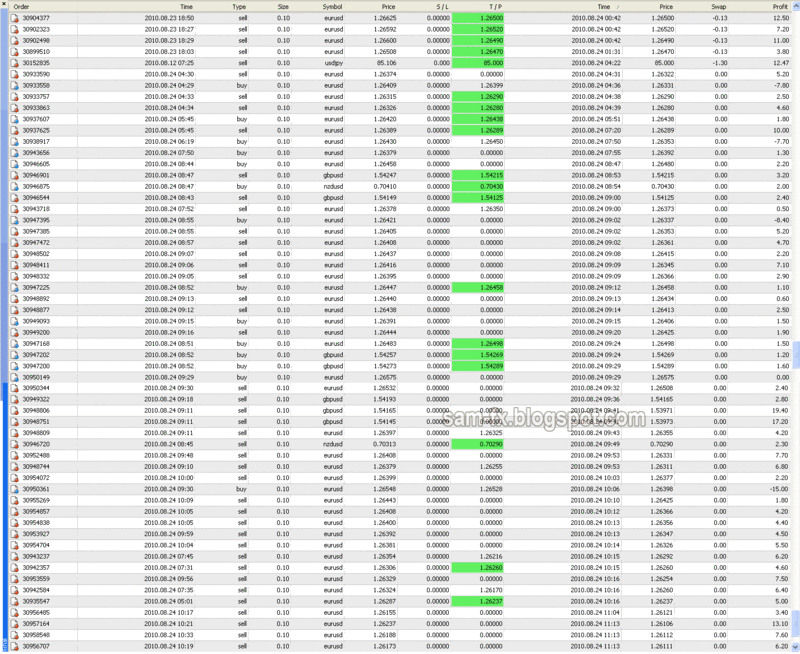
24 August 2010, I spend the day scalping. This is rare chance I can glue myself in front of the monitor for couple of hours. I was going in aggressive today. And here is my result below.


Well of course this is in demo account. I not good at doing it at any live account yet.

Read more!