Showing posts with label forex strategy. Show all posts

Thursday, 2 September 2010

strategy: Rob Booker’s “Strategy 10”

The past few weeks I feel very much stressed out, and I don’t know why. It seems like all trades doesn’t went my way. This affected my eating and sleeping routine, and this is not good. Then this week I started following “strategy 10”. Surprisingly I feel relax, and happy. “Strategy 10” is not really a trading strategy; it is more to a disciplinary guide. This is the first ebook written by Rob Booker. Let’s see how this works.


“Strategy 10” is not really a trading strategy. There are no entry rules or indicators to follow. The “strategy 10” simply says that, we look for trade that could earn 10 pips. After 10 pips, we are out. We well not be looking at 100 pips trade. Each day we earn 10 pips and turn off the monitor. It takes some times to get used to it, but I think this is a good way to train our discipline too. Rob Booker did mention that we could trail our stops if the price moves our way, to capture more pips. So the rule is simple: Take 10 pips each day; turn off the monitor.

I not sure how real Rob Booker is as a trader (there are many people commented on the course he giving). But this “strategy 10” does help me be less tress; and trained my discipline in trading. To obtain a free copy of this ebook, you may visit Rob’s website at http://www.robbooker.com/

p.s. Just notice he keep facial hair since last time I visit… nice choice of style, I like it.. lol.


Read more!

Wednesday, 11 August 2010

tips: trailing stops

Trailing stops is a technique to yield maximum return from a strong trend. Many strategies apply trailing stops as the exit strategy. Use this wisely and it can bring a lot of profit. However like other strategy this has pro and cons also. Let us look at how to use trailing stops.


Trailing stops is moving your stop lost after the price have move significant amount. This can ensure you are safe if the price decided to suddenly move back; in the same time can let you trail the price for maximum profit.

There might be different methods of setting stops; below is my method.
  • The first stop depends on the strategy you use.
  • When price move to significant amount and start consolidating, watch the price
  • When price continue move along the trend, move the stop to the consolidating place
  • I like to use the lowest level on the consolidating place add in spread and few pips
  • Continue to do that when price move along

The photo below show how I perform trailing stops. I have removed the indicators to make the chart clearer.


Hope this will help you on your trading.

Read more!

Friday, 6 August 2010

strategy: Indicator line cross

X Mark the spot. This couldn’t be more true for technical analysis. In many systems, line crossing is the trigger to enter, and also exit a trade. Here I will list down few of the more common one. Maybe this will give you idea in developing your own trading system.


EMA/SMA Lines cross
This should be the most famous trigger method. The trigger happens when a faster EMA (or SMA) line cross the slower one. And the exit usually when the lines cross in opposite direction. One famous example is the 5-13-62 system by Rob Booker. The system triggers enter condition when the 5EMA crosses the 13EMA. Another famous example is the 50EMA crosses the 200EMA.


Price crosses EMA line
This is another trigger similar to above one. The trigger happens when the price cross the EMA line. Example is the “5-minute-momo-trade” method I discussed some times ago. In this method false breakout are more frequent compare to above method. Confirmation with candle sticks pattern will bring more accuracy.


MACD / Signal line cross.
I have discussed this in my previous post about MACD. The buy/sell trigger happens when MACD cross above or below the signal line. The signal line is 9EMA of MACD, which move slower then the MACD line. When the MACD crosses above the signal line, its indication of uptrend. Confirmation with zero line crossing on MACD and other indicators are needed to make a good entry.


Stochastic line cross
The slow line and fast line in stochastic cross is good indication of trend turning. When the fast %K line cross above the slow line, it is one of the buy signal. But use this alone is not a good indication, confirmation with other indicators are needed to enter a trade.


Momentum line cross
I just learn this not long ago. It’s really amazing when I first saw it. Using 2 momentum lines in one indicator window. When the line with smaller period cross the longer period line, its good signal to trigger the trade. The system I saw actually uses 2 windows; one with 10 and 14 period momentum line, the other with 1 and 5 period momentum line.


RSI line cross.
I have yet to experiment with this. The idea is putting 2 RSI line in one indicator windows. The period of RSI is one shorter and one longer. When the shorter period RSI cross the longer period one, it is signal to enter a trade.

There are many other possible combination out there. The above are few that I just learned. Feel free to leave your comments here.

Read more!

Friday, 30 July 2010

strategy: 5 minutes momo trade

This trade strategy was introduced by investopedia in their free ebook. This is presented in their free ebook "High probability Trading Setup". This is originally developed for inpatient people (like me) for trading the 5 minutes chart. I just loved the simplicity and the fact that it does works really well. Let’s get more into it below.


As the book written, this is for inpatient people to trade the 5 minutes chart. The setup couldn't get simpler. What we need on our chart is
  • 5 minute chart on any currency (prefer high volatility pairs)
  • 20 EMA on the chart
  • MACD with default setting

These are the original context of the strategy
condition to go long
when the price cross the 20EMA from below to above
confirmation by MACD is above the zero line
Go long on 10 pips above EMA line

condition to go short
when the price cross the 20EMA from above to below
confirmation by MACD is below the zero line.
Go short on 10 pips below EMA line

exit
exit half of your position when target reach.
trail the stops for the remaining.

stop lost
place stop lost at 20 pips below EMA line
place stop lost at recent swing low / high


With proper money management and risk reward ratio, this is quite rewarding trade strategy even without any indicator. The MACD indicator was there to filter out the bad trade so we can avoid false breakout.

However I have made some twist to this system, and here is my version
  • 5 minutes or longer time frame chart
  • 21 EMA (slightly longer)
  • MACD with default setting.

stop lost
stop lost placed at the most recent swing low / high

exit
same as original rule.


Trail the stops of remaining until MACD line starts coming down. Why am I using 21 EMA? Because it is slightly longer, so breakout occur a bit later (more confirmation). Plus 21 is a number in fibs sequence, and also the EMA recommended by fxKnight.

The wonderful thing about this system is that it not only works with 5 minutes chart, but i have tried it with 1 hour chart and it works wonders.


Read more!

Thursday, 29 July 2010

Strategy: 250EMA by fx-tiger

This strategy is invented by a forum member name tiger-fx. It is from a Chinese community forum. According to him, he target to double the capital each year, with only making few trades within a year. Let me explain it more details here.


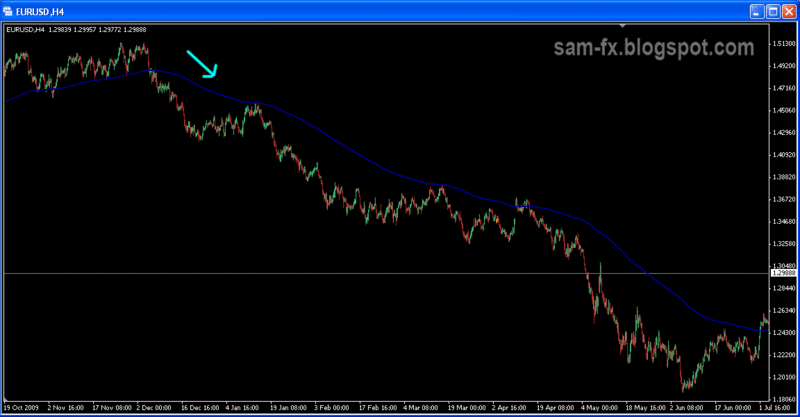
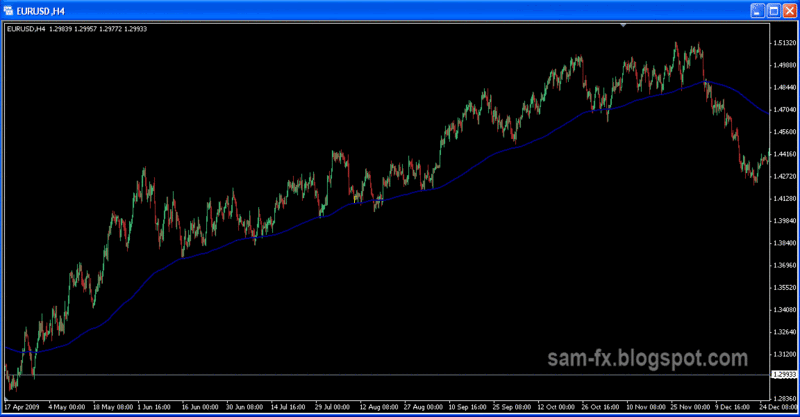
According to tiger-fx, we no need any indicators at all. “No MACD, no stochastic, we need nothing,” according to him. All we need is inserting one 250EMA on our chart. Apparently this is his favorite EMA too. “Go long when EMA pointing up, go long; when EMA pointing down, go short,” according to him. The time frame for this trade is using 4Hour chart.

Setup is fairly simple, we need only 2 thing:
  • Open 4-hour chart.
  • Insert one 250EMA

Entry and exit are fairly simple too:
Enter long when EMA pointing up, Exit when it is pointing down
vice versa for exit

 Go Short when 250EMA pointing down

Why does it work?
Yes it does works. The 250EMA are actually long term moving average, but with weight putting on last candle. 250EMA on 4 hour chart basically calculate the data from the past 1000 hours (250 times 4 hours). Usually long term move will be more significant over long period of time.


Go long when 250EMA pointing up on 4Hour chart


Why it doesn’t work
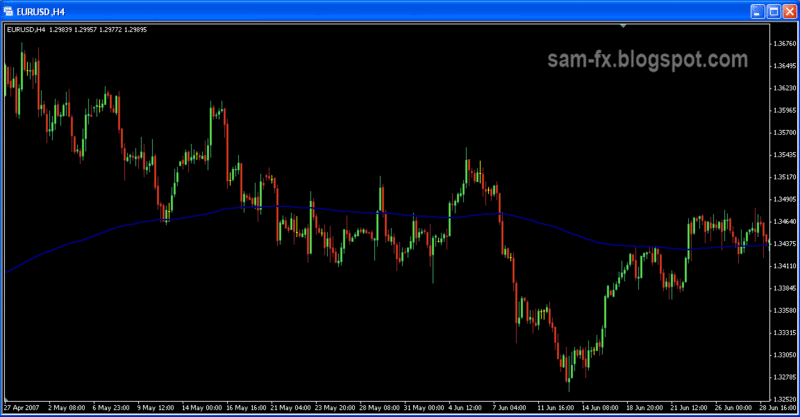
Yes, it doesn’t work too! Many of the time, the 250EMA will be a flat line, where the price will move above, and far above it; or far below. Those move are big gain to be missed out.


Sometimes 250EMA just move sideway, while the price going highly above and below it


So here you go the pro and cons of the system. It does works, but not all the time. Like many other strategy there are pro and cons. There is no perfect system. Feel free to take this as basic and customize to become one of your systems. 


Read more!