Showing posts with label metatrader. Show all posts

Tuesday, 21 September 2010

Metatrader eating up your harddisk space?

Help! Metatrader is eating up my harddisk space! Recently I notice my harddisk running low after few round of backtesting. After some investigation I found out where is the un-used data is gather at. Since there are very less article on the www talking about this, I thought I would share it here.


After running few back test, I notice the data is gather around “tester” folder. This is at /tester/history; in my case, it’s in C:\Program Files\MetaTrader 4\tester\history. I not sure what the file is used for, but they appear after back test. So I suppose this is back-test data. Some can be as large as few gb. Deleting them after back test can free up lots of harddisk spaces.

Read more!

Friday, 17 September 2010

tutorial: History data in Metatrader

Accurate data is important on backtestting. I noticed that there are not much tutorial on backtest in MT4. Here I will share about downloading historical data into MT4. These are some information I have lately. Feel free to drop me a comments if I have missed out smoething.


Historical data can be downloaded through MT4, or external source. I not yet found a source to download the data, so I do it through MT4 platform.

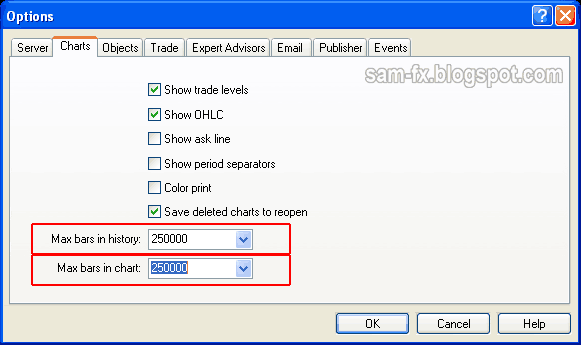
First you need to set the Maximum bar display in chart. Go to “tools”, “options”, then select the “Chart” tab. This option is to set how many bars to keep in history. This will affect how many data you can download. But set it to too high, and you may experience lag in your computer. 


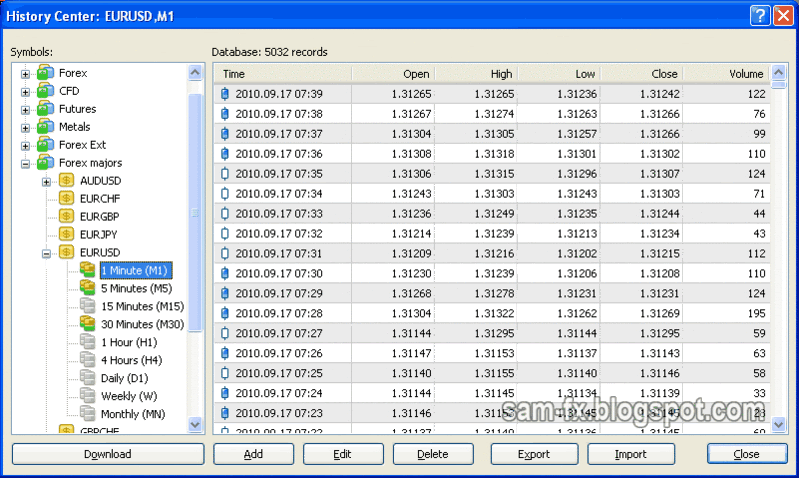
After changing the setting, to go history center. It Is at “tools” , “History Center”, or you can press “F2” key. When it is open, you can see the history center window like below. Double click on the pairs you want the history, then double click on the time frame you like. Usually I would chose “M1” and “M5”. After that, click “Download” button below. There might be warning message appearing, click “OK” to continue.


After that all you need to do is wait for the download to complete. Then your history is ready. Now you can start doing your backtesting.

Read more!

Wednesday, 15 September 2010

My First EA

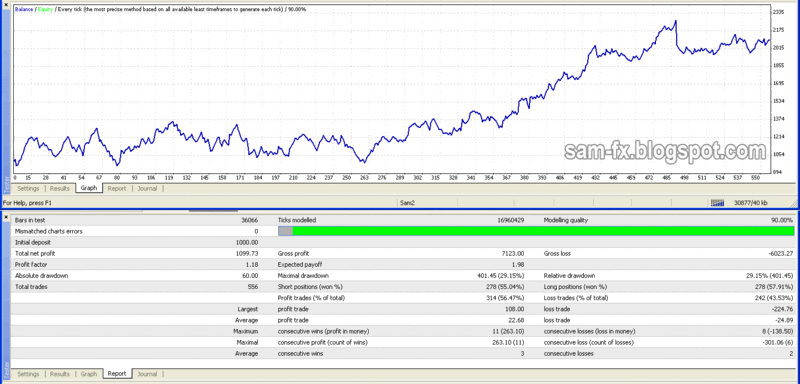
This is my first EA. I writing it based on simple Moving Average Cross system. Adding inside is my own money management rules. So far it tested out OK. Below is the results using data from 2008 to august 2010. Below is the screen capture of the EA tested from Jan 2008 to August 2010. The time frame I used for this back test is 15 minutes. I will post the EA for download soon.


Read more!

Thursday, 5 August 2010

tips: RSI in same indicator windows (MetaTrader 4)

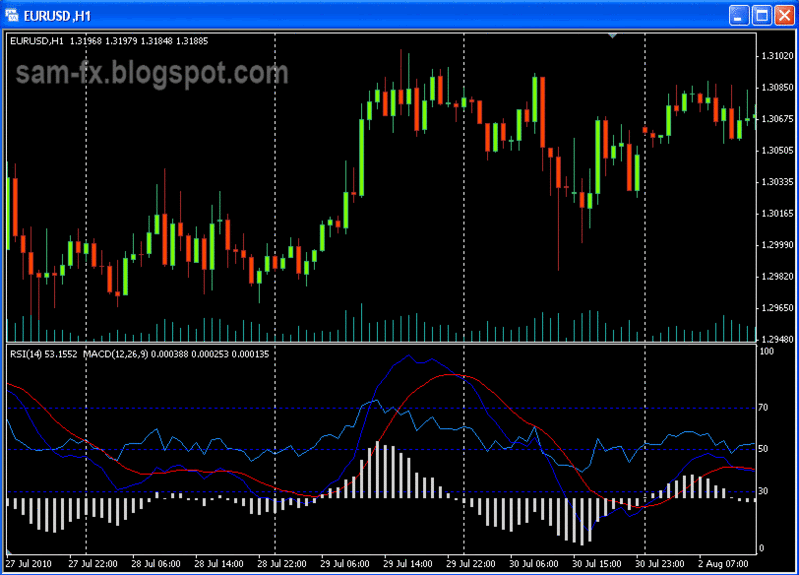
I learn this from BK. Since this is a nice trick so I would share it here. The idea is to put RSI into same indicator window with other indicators. This will give clearer view and can make the overall view less complicated. This trick will show how to put multiple indicators in same windows in MetaTrader 4.


RSI with Stochastic
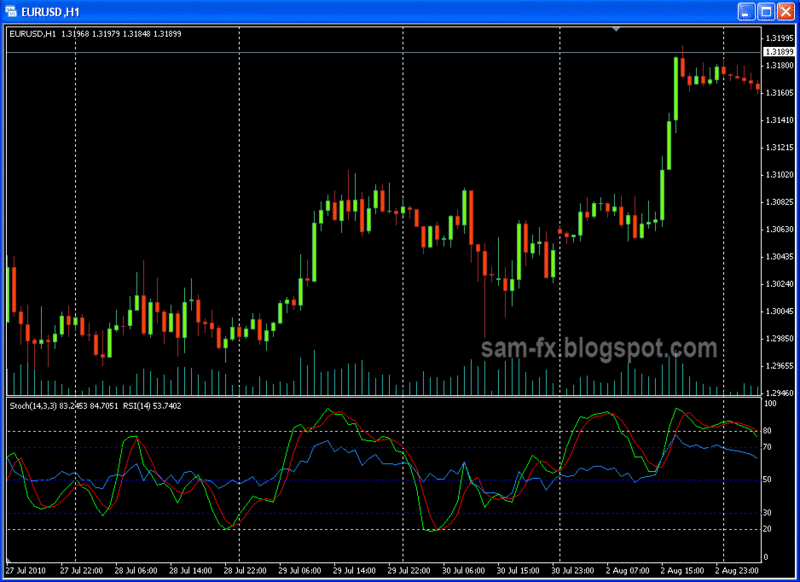
RSI and Stochastic are both oscillator indicator. It’s good to put them together to see if they both agreed with each other. Since they both oscillate between 0 and 100, it is suitable to be putting together too. At a glance we can know what RSI and stochastic are indicating. To put them together, just follow these few steps.
  • Open your chart
  • Insert Stochastic indicator; a new indicator window will appear.
  • Insert level you prefer in Stochastic (maybe 20, 80 perhaps)
  • On the navigator bar at left, expand “indicators”, and drag RSI into the indicator window.
  • Add in the level you prefer in RSI too, but in different color for clear visuals.
RSI together with Stochastic Indicator in same window


RSI with MACD
RSI together with MACD in one indicator window. MACD are trending indicator. BK add in RSI in MACD so that he wont “forgot to check on RSI”. This is simply be done too. The RSI can be added in MACD with the following steps.
  • Open your chart
  • Insert MACD indicator. A new indicator window will appear
  • Drag RSI indicator into MACD indicator window.
  • Add in the level you wants in RSI.
RSI with MACD in same indicator window


Using this trick, you can put multiple indicators into one single window. For me the above 2 are the most useful combination so far.

Read more!

Wednesday, 28 July 2010

tips: Real MACD in MT4 in 3 minutes.

In my last post, I have discussed about MACD in Metatrader. Though it may looks different, the default MACD in metatrader can be quite useful too. However if you wish to get the usual MACD in your Metatrader, there is few ways: 1. Write a script on your own, which take couple of hours. 2. Download a customized MACD, which take around 15 minutes. Now, exclusive on sam-fx.blogspot.com, I going to show you how to make your own MACD within 3 minutes.


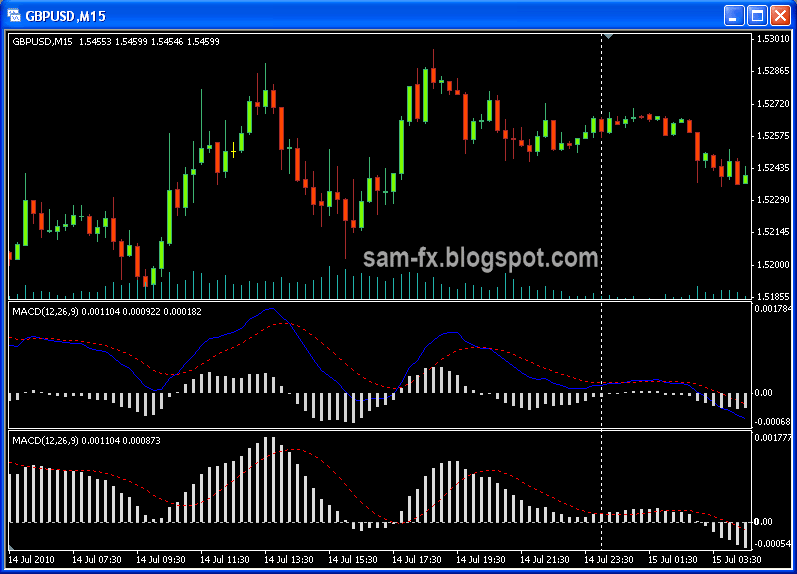
The photo below shows the normal MACD (above) and the default MACD (below). In this case the normal MACD I downloaded from the internet. 


Lets examine what is the component in “normal” MACD.
  • MACD line – 12EMA minus 26EMA
  • Signa line – 9 period EMA of MACD line
  • MACD histogram – difference between MACD and Signal line

And this is MT4 default MACD
  • MACD line – replaced by histogram
  • Signal line – 9 period EMA of MACD


Now to build our “normal” MACD, we will do it one component a time. Firstly is the signal line. The signal line is the same, so we will leave it as it. 

Signal line

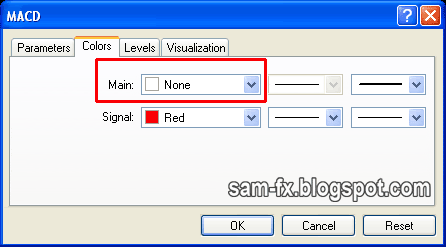
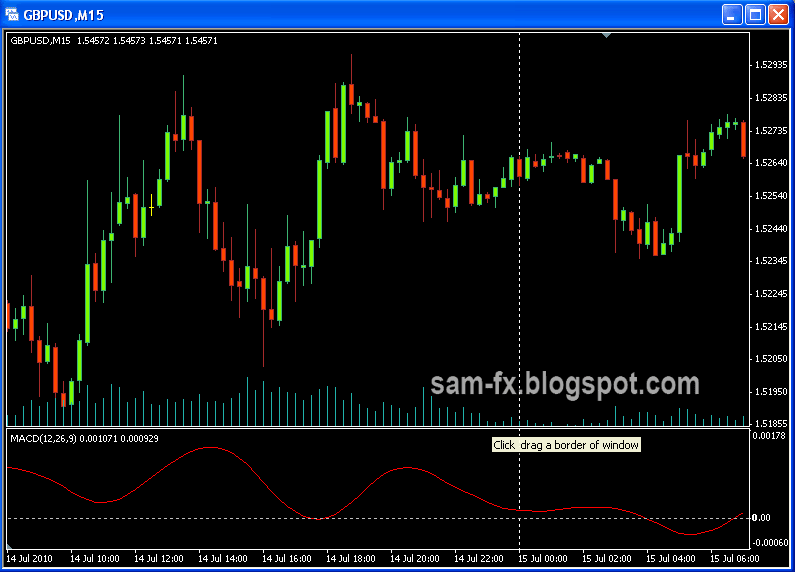
Firstly, go to insert, indicator, and select MACD. Leave the value to default. But we are going to remove the histogram. On the color of the histogram, select “none”. Your chart should look like this now.

Insert MACD

Select "None" here

Your Chart should looks like above


MACD Line

Now the second part is the MACD line. In MT4, the default line is signal line (9EMA of MACD). Now, how to turn this into MACD line? Yes you are right! We leave the setting to 1EMA, and it’s the MACD itself.

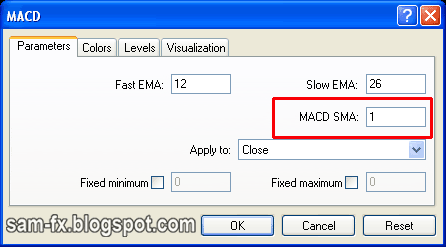
So go to your navigator window, and under “indicators”, drag MACD into your indicator windows. Windows should prompt for input. Now the default setting should be change to 12, 26, and 1. Same as above, we going to remove the histogram. So on the color of the histogram, select “none”. Your graph should looks like this now.

Drag  another MACD inside your indicator window


Change the SMA to 1

Change to any color you like

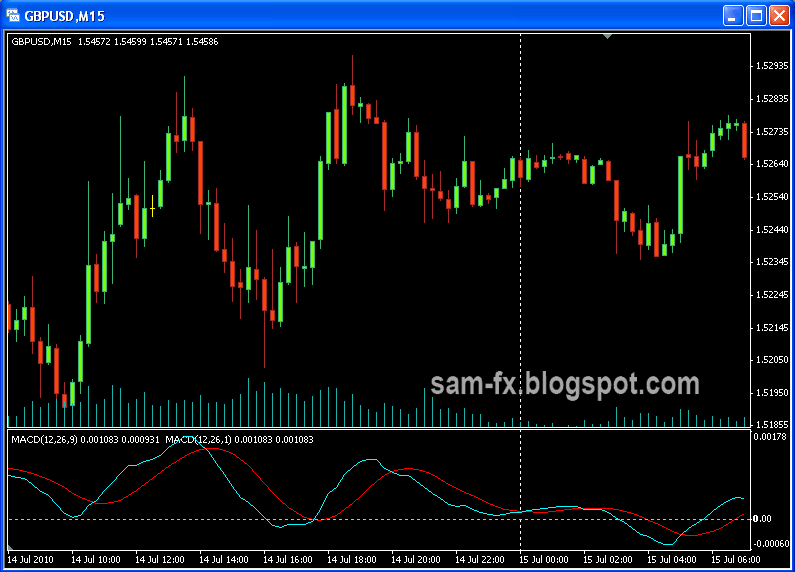
Your chart should looks like this now.

Histogram

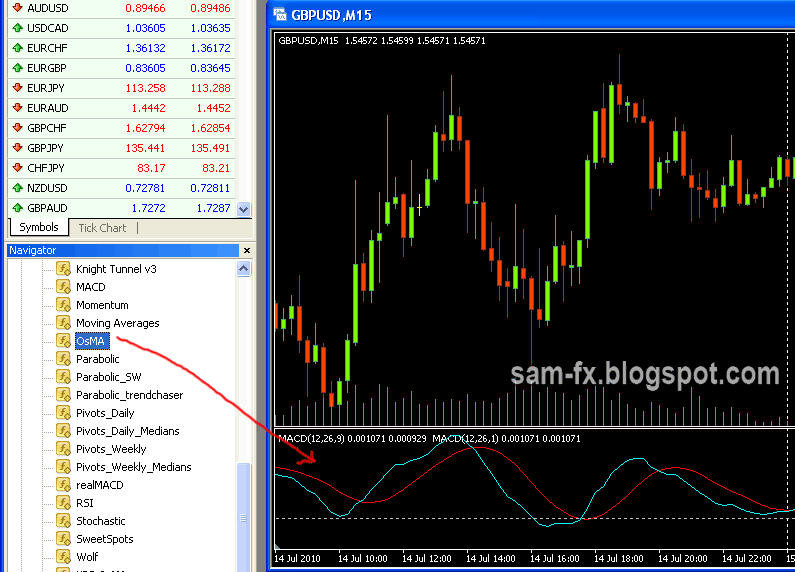
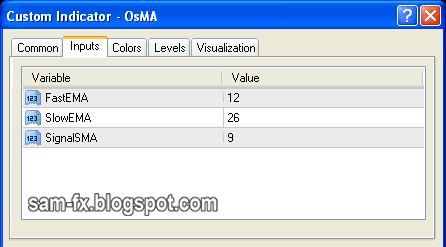
Now the last part, histogram. I notice another indicator, the OsMA is MACD minus signal line. So we going to use it. On the navigator pane, drag the OsMA (under “custom indicators”) into your indicator windows. You should leave the setting as default (12,26, 9). 

 Drag the OsMA indicator in

Leave the default setting

Your chart should looks like this.


And there you go, you have your real MACD indicator, and all under 3 minutes of work!
Your graph should looks like this. I have put in the real MACD indicator for comparison.

Comparison of 2 MACD. They are similar :)

Now one final important note, because its 3 indicators in 1 window, the scale tends to float. I would set the minimum and maximum scale for them. You can do it under the property of each indicator.

 Remember to set the scale


Read more!

Saturday, 10 July 2010

MetaTrader 4 Trading Platform

This is one of the most common trading platform out there currently. It may not be the best, but this is what I many other traders use. When you register for your live or demo account, you could check with your broker about trading platform. Most of them will offer you their own web-based platform and also allow you to use metatrader.
To obtain your own copy of MetaTrader, please follow the link here: http://www.metaquotes.net/en/metatrader4/trading_terminal. On the other hand your broker website will have their own download link too. If you download your copy of MetaTrader from metaquotes website, you need the following information to login to your account: username, password, IP address for the server. The IP address could be obtain from your broker. Some of them list it on their website, while some you may need to obtain them through their support team.


Once you have everything ready, its time to get yourself familiar with the platform. At very basic, you should explore and get yourself familiar with:
  • Viewing charts for different currency pairs
  • Viewing tick chart for different pairs
  • Making instance order
  • Making pending order
  • Setting your stop and take-profit

Once you get yourself familiar with the platform, you may explore the following functions
  • change the chart display
  • drawing trend-lines, support / resistance
  • adding indicators in their default form
  • changing the parameter in indicators
  • saving your own template
    import custom indicators / templates

It took me few hours to get familiarize with all the functions in Metatrader. I would say it's a user friendly trading platform. There are many other customization available in Metatrader to be explore, such as creating your own custom indicators. So why not get a copy and try out yourself, and happy trading.


Read more!