Showing posts with label tips. Show all posts

Tuesday, 21 September 2010

Metatrader eating up your harddisk space?

Help! Metatrader is eating up my harddisk space! Recently I notice my harddisk running low after few round of backtesting. After some investigation I found out where is the un-used data is gather at. Since there are very less article on the www talking about this, I thought I would share it here.


After running few back test, I notice the data is gather around “tester” folder. This is at /tester/history; in my case, it’s in C:\Program Files\MetaTrader 4\tester\history. I not sure what the file is used for, but they appear after back test. So I suppose this is back-test data. Some can be as large as few gb. Deleting them after back test can free up lots of harddisk spaces.

Read more!

Monday, 30 August 2010

tips: true value of a pair

I read this from a book, so I think I share here too. When the price of the pair is near to Moving Averages (example EMA), it is closer to its true value. When the pair is moving further from the MA, it is said that the pair is overpriced. The Moving average can be at any value. The closer the price to the Moving Average, the more value to the price. When price moving away from moving average, it is overprice; and when we bought overpriced pair, we hope for bigger fool to bought it too and make the price go further. So the conclusion is, when the price is closer to MA, the price is more worth the value.
Read more!

Thursday, 19 August 2010

Retracement vs Reversal.

Retrace is a place where price make a pause, retrace a bit, and end up continuing moving on the trend. Reversal is a place where the price just turns and moves on opposite direction. I always having hard time identifying them both. Sometimes I mistaken a retracement for a reversal, and sometimes thinking it was reversal but only it is retracement. How to differentiate them both? After some research I found out few ways to differentiate reversal from retracement. Although they are not completely accurate all the time, they do give me better probability on my trade.


Candle stick pattern.
In my previous post about candle stick here and here, I talk about various pattern. The few common patterns are easily identified as reversal pattern. Some examples are engulfing, morning star, evening star, etc. At retracement, usually there are clutters of “indecisions” candles, such as doji and spinning top; which have very small bodies. But from my experience this is least accurate way to differentiate reversal and retracement. This is because those pattern are shown in retracement too.


Volume
Very little information on this. I learn this from investopedia website. (http://www.investopedia.com/articles/trading/06/Retracements.asp). According to the article, there will be large volume during reversal, and small volume during retracement. This is because retracement is form by profit taking by retail traders.


Trend lines
According to this forum post (http://forums.babypips.com/newbie-island/28589-retracements-reversals.html), trend lines are one simple way to identify reversal. According to the post, trend line is drawn on the tops and bottoms that form a channel. When the price breaks the channel with both new tops and bottom outside it, it could be a reversal.


Chart Patterns
Chart patterns are another way to differentiate reversal and retracement. According to the book “Chart Pattern Trader Supplement”, the patterns can be classified into 3 groups, continuation (retracement), reversal, and both. The most patterns that show continuation are triangles, flags and pennant. The most common reversal pattern is double tops (and double bottoms).

Read more!

Wednesday, 11 August 2010

tips: trailing stops

Trailing stops is a technique to yield maximum return from a strong trend. Many strategies apply trailing stops as the exit strategy. Use this wisely and it can bring a lot of profit. However like other strategy this has pro and cons also. Let us look at how to use trailing stops.


Trailing stops is moving your stop lost after the price have move significant amount. This can ensure you are safe if the price decided to suddenly move back; in the same time can let you trail the price for maximum profit.

There might be different methods of setting stops; below is my method.
  • The first stop depends on the strategy you use.
  • When price move to significant amount and start consolidating, watch the price
  • When price continue move along the trend, move the stop to the consolidating place
  • I like to use the lowest level on the consolidating place add in spread and few pips
  • Continue to do that when price move along

The photo below show how I perform trailing stops. I have removed the indicators to make the chart clearer.


Hope this will help you on your trading.

Read more!

Monday, 9 August 2010

Tips: Which news and calendar?

While technical analysis is always paid attention to, fundamental analysis is not less important too. Together with technical analysis and fundamental analysis will give us high probability trade. Fundamental analysis is about the economic strength of a country, which indirectly will relate to the currency strength. One part of fundamental analysis will be watching news report. So which news source do you refer to? Here I will share some source that I reference.


Forexfactory calendar
This is my favourite! I would say this is the best source for my forex calendar. It will highlight every news report and put them into a nice list. Register a free account, and you can customize the calendar to match your timezone too! Very convenient. A small icon will show the importance of the economy report, and there are also small explanations for each news. The table is very nice layout according to time and date. There are also forecast, actual, and previous data too in the same table. Very convenient, we could look at everything at a glance.

For ForexFactory news, you can visit http://www.forexfactory.com/calendar.php


DailyFX calendar
This is another forex calendar. They layout each event properly. Everything is properly layout; and explanation are included too. This is as good as the ForexFactory calendar. For me personally I would still prefer ForexFactory calendar, but nonetheless this is one good calendar to refer to.

For DailyFX calendar, you can visit http://cdn.dailyfx.com/calendar/


Barron’s Economic Calendar.
This is another economic calendar. However I think the layout is not as clear cut as the previous tow. But it is worth to reference too. For the Barron’s economic calendar, you can visit http://online.barrons.com/public/page/barrons_econoday.html


ForexNews
This is a website dedicated for Forex news. You can view the latest news here. Beside that, other kinds of articles also available. Good resource for all forex trader. For your dose of forex news, you can visit http://www.forexnews.com/


CNBC news
Many traders get their economy news here. No matter you are forex traders or stock market investors, or other kind of traders. There are many detail news about economy here. To get your prompt CNBC news you can go to their website at http://www.cnbc.com/


Google News
Once of the recent page on the World Wide Web. The Google News feature news all over the world. You can use the powerful search function and key in your favourite pairs, and the related news will pop up. I like the feature that google will indicate when is the news updated. If you have google account, you may customize Google News to open economic news each time you visit the news section. To access google news, you can go to http://news.google.com


There are many other source for your economic calendar and news on the World Wide Web. You may come across some very useful one too. The above highlighted are just tip of the iceberg; but they are my favourite few.


Read more!

Thursday, 5 August 2010

tips: RSI in same indicator windows (MetaTrader 4)

I learn this from BK. Since this is a nice trick so I would share it here. The idea is to put RSI into same indicator window with other indicators. This will give clearer view and can make the overall view less complicated. This trick will show how to put multiple indicators in same windows in MetaTrader 4.


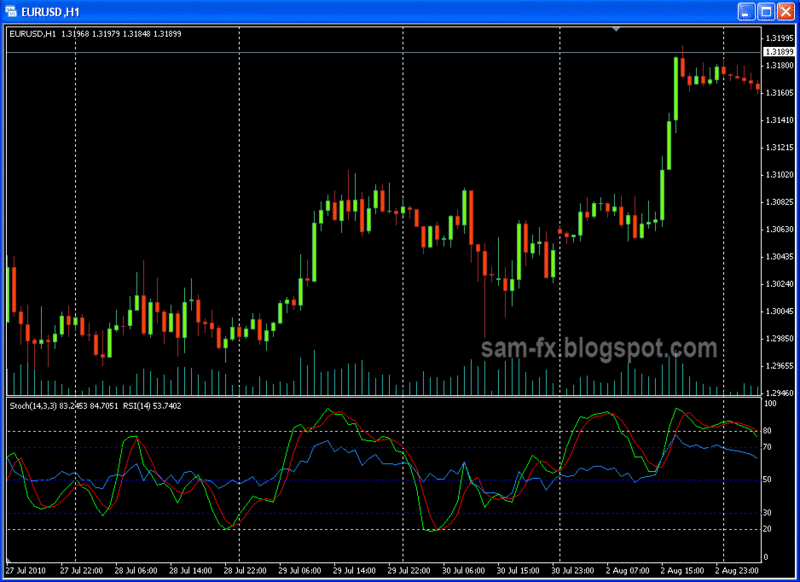
RSI with Stochastic
RSI and Stochastic are both oscillator indicator. It’s good to put them together to see if they both agreed with each other. Since they both oscillate between 0 and 100, it is suitable to be putting together too. At a glance we can know what RSI and stochastic are indicating. To put them together, just follow these few steps.
  • Open your chart
  • Insert Stochastic indicator; a new indicator window will appear.
  • Insert level you prefer in Stochastic (maybe 20, 80 perhaps)
  • On the navigator bar at left, expand “indicators”, and drag RSI into the indicator window.
  • Add in the level you prefer in RSI too, but in different color for clear visuals.
RSI together with Stochastic Indicator in same window


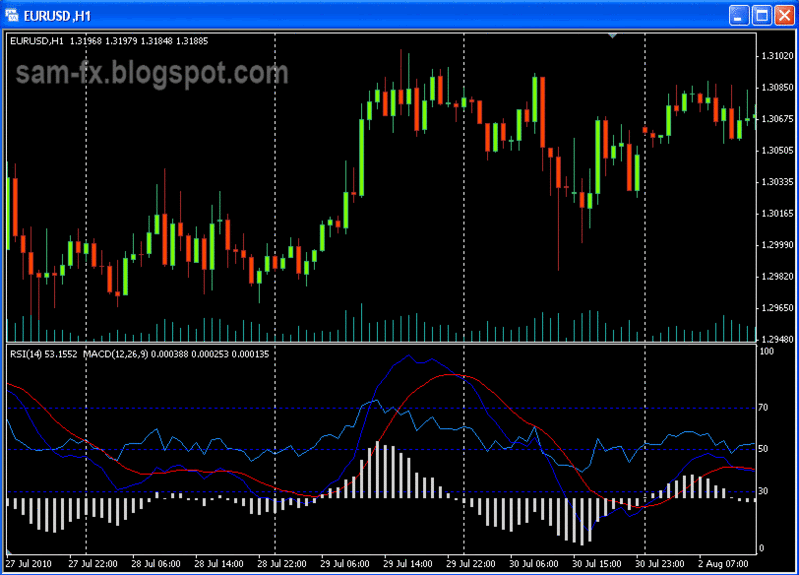
RSI with MACD
RSI together with MACD in one indicator window. MACD are trending indicator. BK add in RSI in MACD so that he wont “forgot to check on RSI”. This is simply be done too. The RSI can be added in MACD with the following steps.
  • Open your chart
  • Insert MACD indicator. A new indicator window will appear
  • Drag RSI indicator into MACD indicator window.
  • Add in the level you wants in RSI.
RSI with MACD in same indicator window


Using this trick, you can put multiple indicators into one single window. For me the above 2 are the most useful combination so far.

Read more!

Wednesday, 28 July 2010

tips: Real MACD in MT4 in 3 minutes.

In my last post, I have discussed about MACD in Metatrader. Though it may looks different, the default MACD in metatrader can be quite useful too. However if you wish to get the usual MACD in your Metatrader, there is few ways: 1. Write a script on your own, which take couple of hours. 2. Download a customized MACD, which take around 15 minutes. Now, exclusive on sam-fx.blogspot.com, I going to show you how to make your own MACD within 3 minutes.


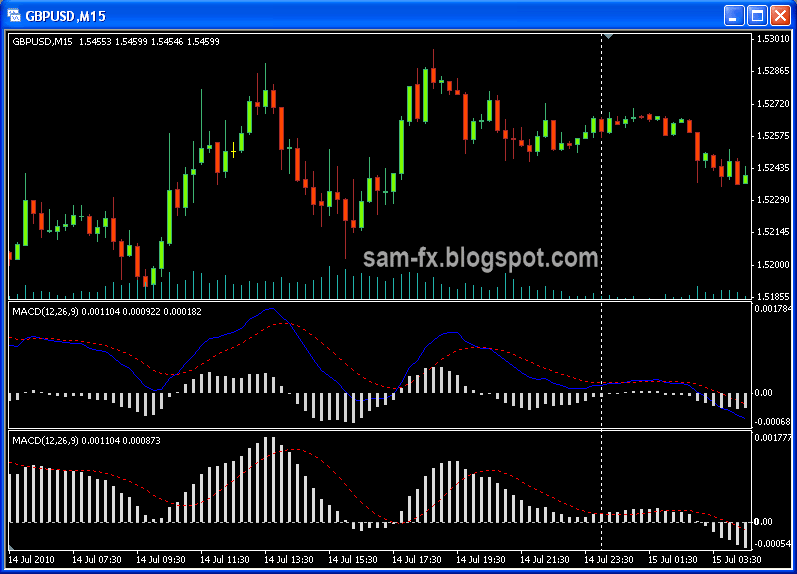
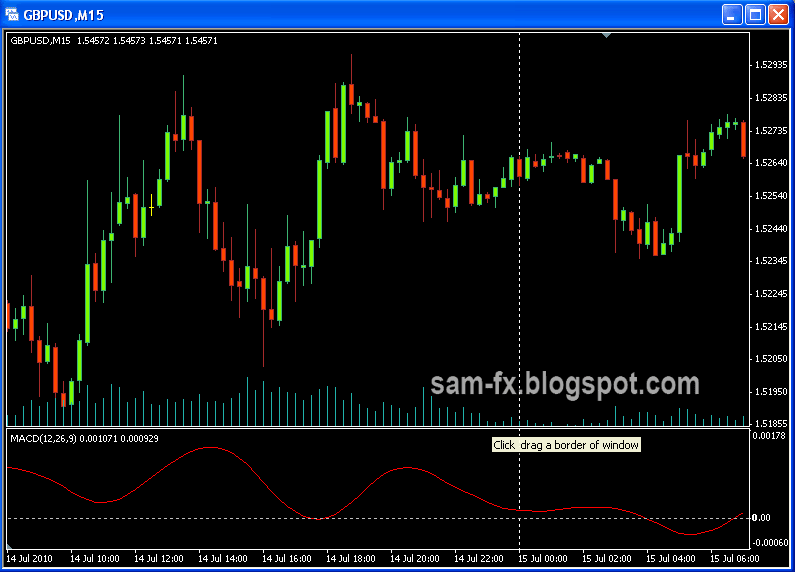
The photo below shows the normal MACD (above) and the default MACD (below). In this case the normal MACD I downloaded from the internet. 


Lets examine what is the component in “normal” MACD.
  • MACD line – 12EMA minus 26EMA
  • Signa line – 9 period EMA of MACD line
  • MACD histogram – difference between MACD and Signal line

And this is MT4 default MACD
  • MACD line – replaced by histogram
  • Signal line – 9 period EMA of MACD


Now to build our “normal” MACD, we will do it one component a time. Firstly is the signal line. The signal line is the same, so we will leave it as it. 

Signal line

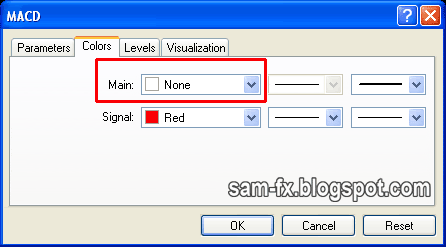
Firstly, go to insert, indicator, and select MACD. Leave the value to default. But we are going to remove the histogram. On the color of the histogram, select “none”. Your chart should look like this now.

Insert MACD

Select "None" here

Your Chart should looks like above


MACD Line

Now the second part is the MACD line. In MT4, the default line is signal line (9EMA of MACD). Now, how to turn this into MACD line? Yes you are right! We leave the setting to 1EMA, and it’s the MACD itself.

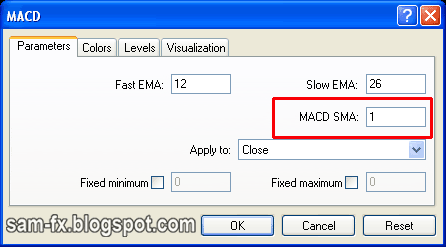
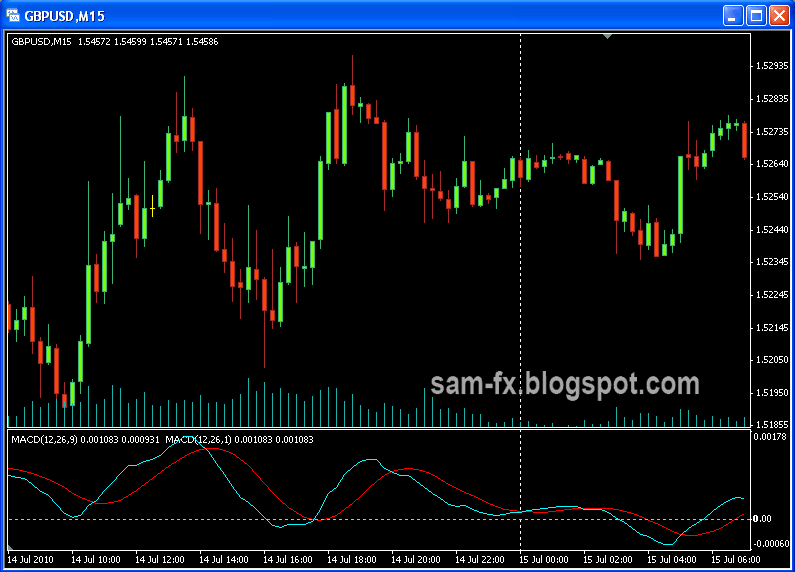
So go to your navigator window, and under “indicators”, drag MACD into your indicator windows. Windows should prompt for input. Now the default setting should be change to 12, 26, and 1. Same as above, we going to remove the histogram. So on the color of the histogram, select “none”. Your graph should looks like this now.

Drag  another MACD inside your indicator window


Change the SMA to 1

Change to any color you like

Your chart should looks like this now.

Histogram

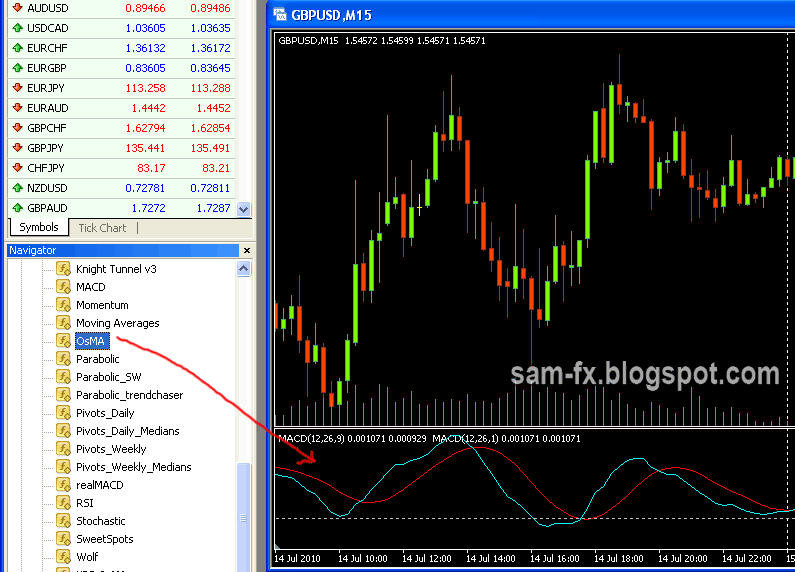
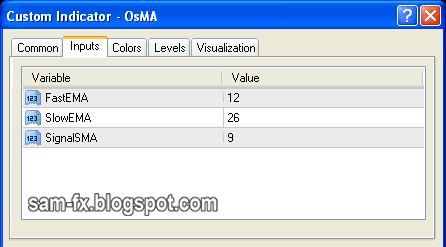
Now the last part, histogram. I notice another indicator, the OsMA is MACD minus signal line. So we going to use it. On the navigator pane, drag the OsMA (under “custom indicators”) into your indicator windows. You should leave the setting as default (12,26, 9). 

 Drag the OsMA indicator in

Leave the default setting

Your chart should looks like this.


And there you go, you have your real MACD indicator, and all under 3 minutes of work!
Your graph should looks like this. I have put in the real MACD indicator for comparison.

Comparison of 2 MACD. They are similar :)

Now one final important note, because its 3 indicators in 1 window, the scale tends to float. I would set the minimum and maximum scale for them. You can do it under the property of each indicator.

 Remember to set the scale


Read more!

Monday, 26 July 2010

tips: Market hours and activity.

In my last posting about market hour, I talk about market hours. Its clear that not all the time the market is active. The best hours should fall when the market is overlapped. We could see more activity during those times. Here I would share another piece of information that I got. Among the major pairs, some are more active compare to other in different sessions.


The figure above shows the currency pairs during Asia (Toyko) and London Session. On Asia session, seems like the most active pair is USD/JPY, and seconds by EUR/USD. The rest of the currencies don’t seem to have much activity. On the London session, the most traded pairs are the EUR/USD, and GBP/USD. It seems that Tokyo session is quieter than London session.

There you go, another piece of information. Use this to wisely to improve your winning possibility.

Read more!

Friday, 23 July 2010

Basic: Divergence

When I first learn Forex, I saw this word everywhere. Divergence and convergence in almost every article I read. But I not pay much attention to it. Later on I learn that regular-divergence and hidden-divergence can be important part on our trading strategy. Here I will share what I know about divergence.

Indicators are derives from price (and sometimes volume). They usually follow the direction of the price. Divergence is the phenomena where price is making a trend, but the indicators go opposite direction of the trend. The indicator signal “diverge” from the price, thus come the name. There are 2 types of divergence, regular divergence and hidden divergence. Divergence can spotted on any indicators, some fine examples are MACD, RSI, stochastic, etc.

Regular divergence usually shows the trend might be weakening and reversal is near. Hidden divergence usually shows that there is temporary retrace happening, and the trend might continue moving back to the main direction.


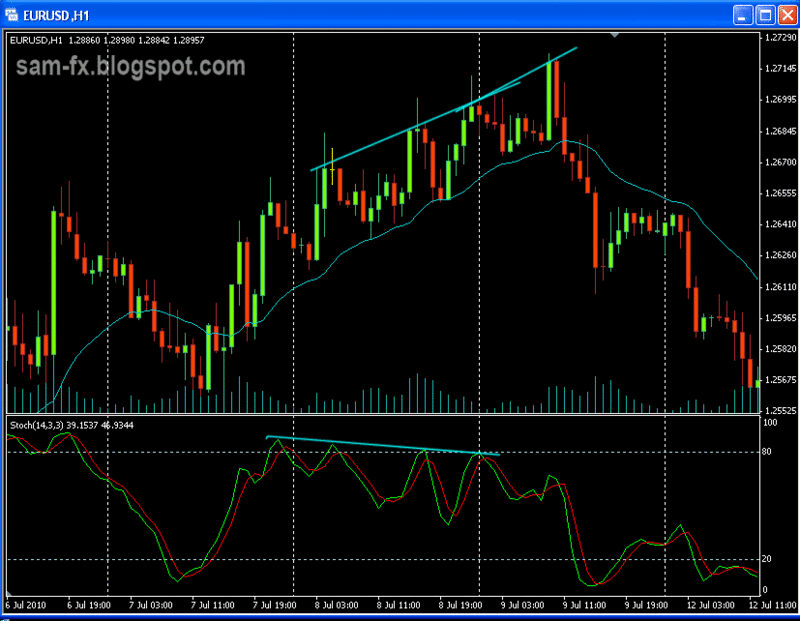
Regular bearish divergence
When price moving on an uptrend, the price is making a series of higher high. On the same time, the indicator will be making a series of lower high. This is regular bearish divergence. This show the bulls are weakening and the bears might take over soon in price reversal.


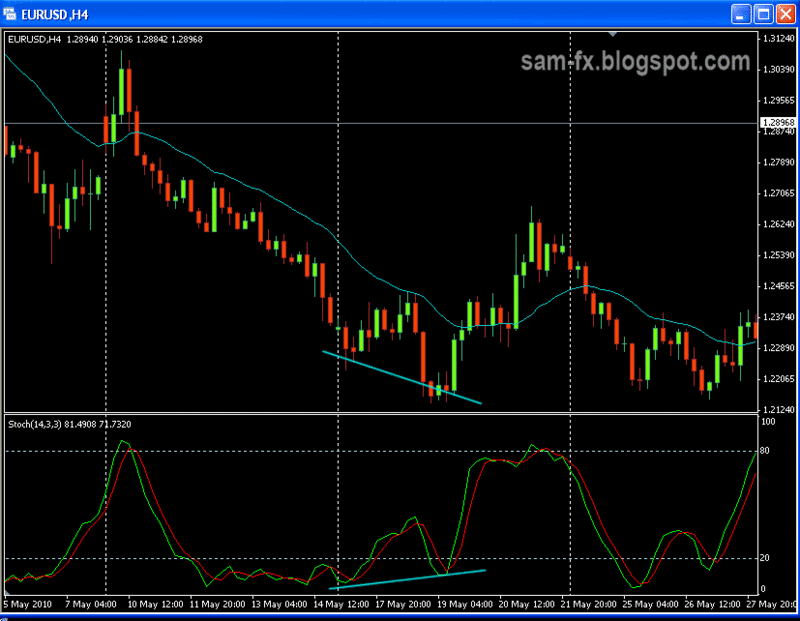
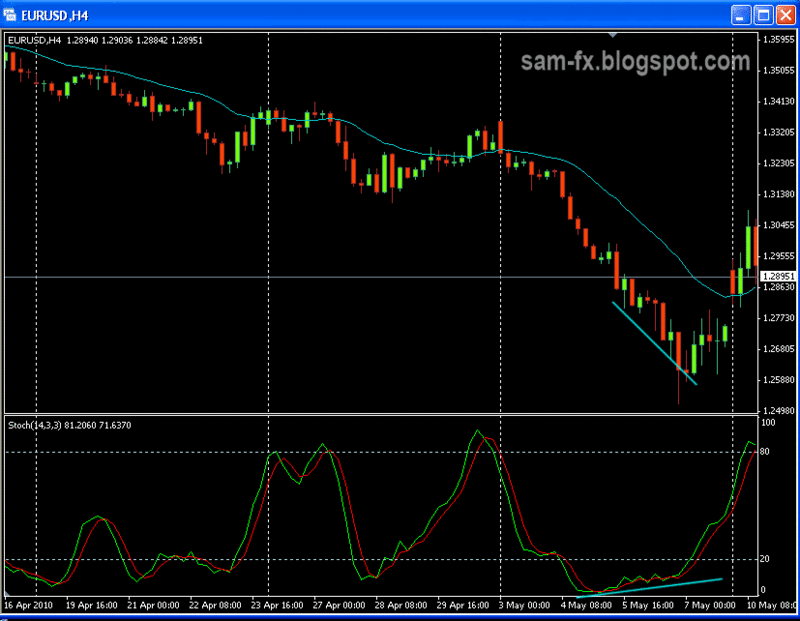
Regular bullish divergence
In downtrend, the price is making series of lower low. But the indicator will be making a series of higher low. This is sign of regular bullish divergence. This usually indicates that the bears are weakening, and the bull will starts to take over soon on price reversal.


Hidden bullish divergence
On an uptrend, the price is making a series of higher lows, however lower lows are shown in indicator. This is sign of hidden bullish divergence. This means that the dip are just a pause and price will continue to move in the same way.


Hidden bearish divergence
On a downtrend, the price will be making a series of lower high, however the indicators will show higher high. This is hidden bearish divergence. This shows that the recent high is just a pause, and the price will continue moving the same direction.

Lets loo at some examples:
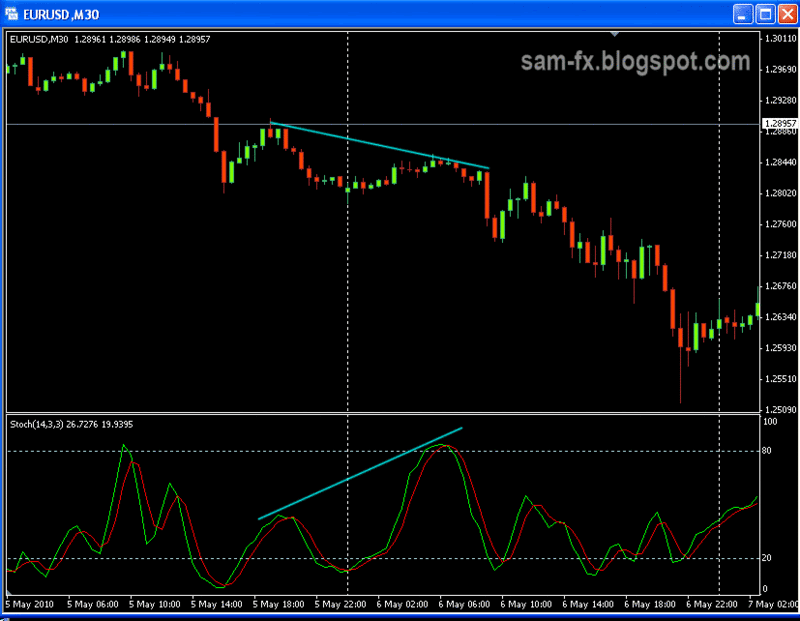
Regular bearish divergence. Price making higher high but indicator shows lower high. 
Notice soon after bearish divergence appear, the reversal happens.


Regular bullish divergence. Price making lower low, indicator making higher low. 
Notice that the reversal happens soon after the divergence.


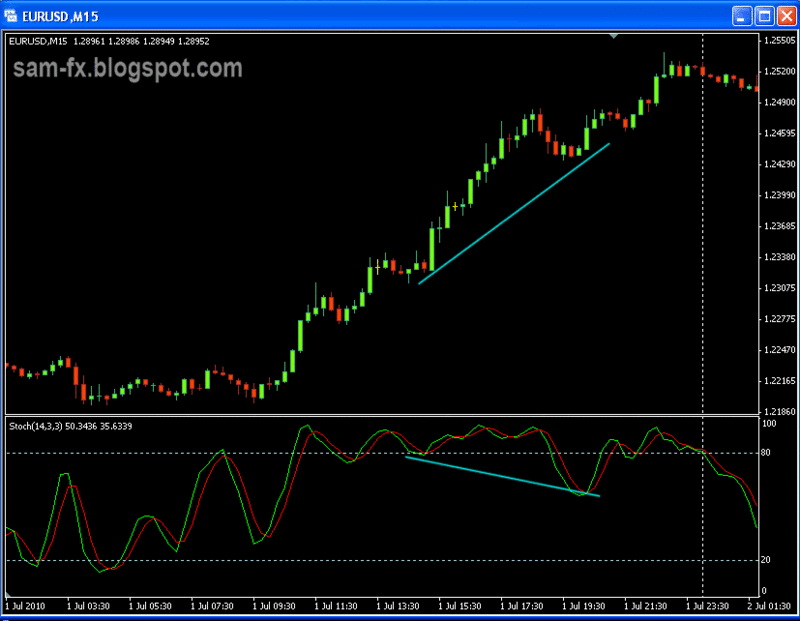
Another classic bullish divergence. Price making lower low, indicator making higher low.


A hidden bearish divergence. Price moving down making lower high. Indicator making higher high.
Price continues to move in the same direction after the hidden divergence.

A hidden bullish divergence. Price moving up making higher low. Indicator showing lower low.
Price continue moving in the same direction after the divergence.


Although divergence is not a 100% confirmation on reversal (or continuation), but it is a good indicator to watch out for. With combination on candle stick pattern and other indicators, this can create a very profitable trade. 


Read more!

Wednesday, 14 July 2010

basic: Support / resistance

This is one of the first basic we learn. Support and resistance, they are very simple, yet very useful on our daily trading life. Some people do not refer to them, and some people think they are important. I will now explain more below


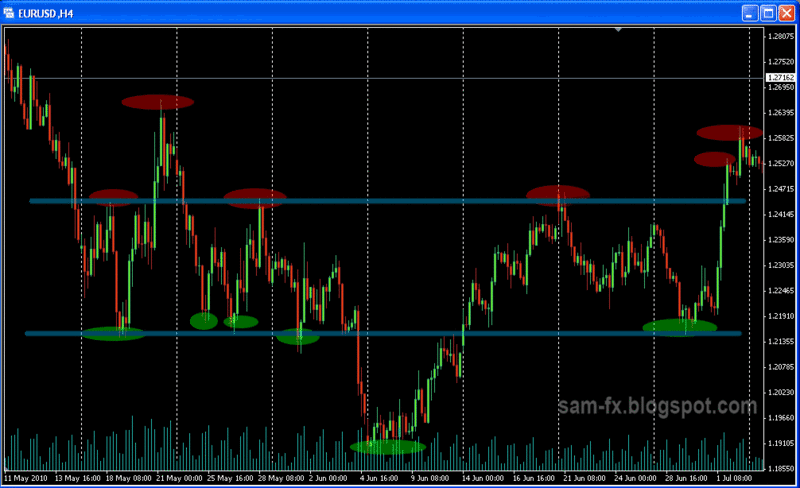
Support is a place where a downtrend stops moving, and retrace. Resistance is where an uptrend stops and retrace. Look at the chart I capture below. The red circle is support, while the green circle marks the resistance.


Support and resistance appear in all timeframe. Usually the one on bigger timeframe are more significant. Often support or resistance will get re-tested. The more time the level being touch, the stronger that level is as support / resistance.

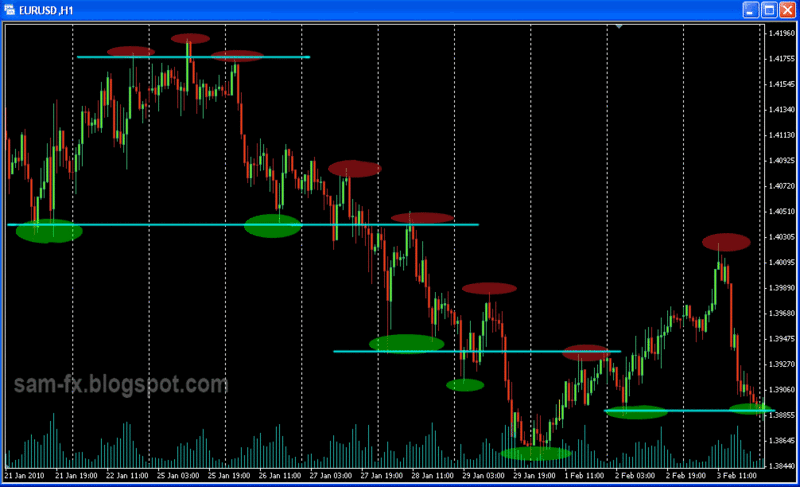
Often support may become resistance, once they are broken. Same goes with resistance, they may become support once it’s broken. On the chart I draft below, I have indicated a blue line. Notice that once the support is being broken, it will turn out to be resistance later on.


Often neglected, support and resistance is once of the most useful tools in a traders toolbox. Properly draw your support and resistance and you may avoid few high risk trades.

(p.s. The illustration above are not accurate, as I grab it from live chart from my MT4)


Read more!

Friday, 9 July 2010

tips: are you trading the right time?

Forex market is 24 hours a day. Only times the market ‘sleeps’ is at weekend. But this does not mean that the market is highly active all day round. Most of the time the market will have low volume and moving slowly, and this will make beginners like me feel frustrated.

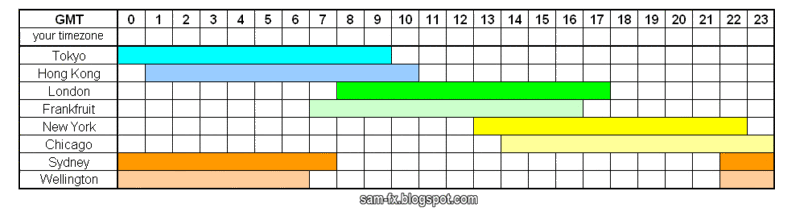
There are 3 main forex markets around the world, and some smaller one. After some research, I have summarized the opening and closing of each market into a table. The overlapping time between few markets will be the best time to trade. And usually London session will be the most active session.

Here I proudly present to you, forex market hour table by sam-fx.blogspot.com. In the table, there are 2nd row empty, which allow you to fill in your timezone (according to GMT at first row). After print out, with a glance you may know which is the best time for you to trade. Please click on the image to enlarge.


Read more!

basic: Bid? Ask? Buy? Sell?

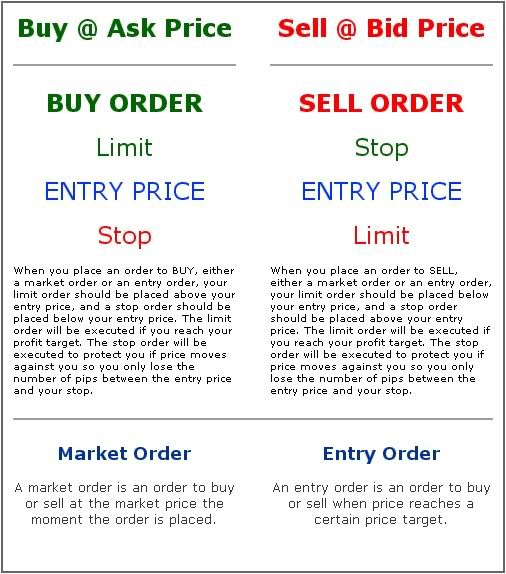
Many beginners like me, always confused about those terms, such as bid price, ask price, buy stop, buy limit, sell stop, sell limit, etc. And also few other terms such as stop loss, take profit, etc.

To put it simple, we can turn on the ask price on our charting tools (usually only bid price are shown). When we buy, we are buying with the Ask Price. When we sell, we sell according to the Bid Price. The difference between ask and bid, is called 'spread'. This is how the brokers earn from us.

To make it simple for everyone, here is one very easy to use illustration. This is very useful for me and I hope it can give you some help too.


Read more!