Showing posts with label RSI. Show all posts

Wednesday, 8 September 2010

basic: RSI (part 2, more information)

Not long ago I have posted about the Relative Strength Index (RSI). In the post I have highlight some way to use this indicator. Recently I have found out a bit more information about RSI. Here I would like to share out the few more points I have learned.


RSI vs EMA, RSI period
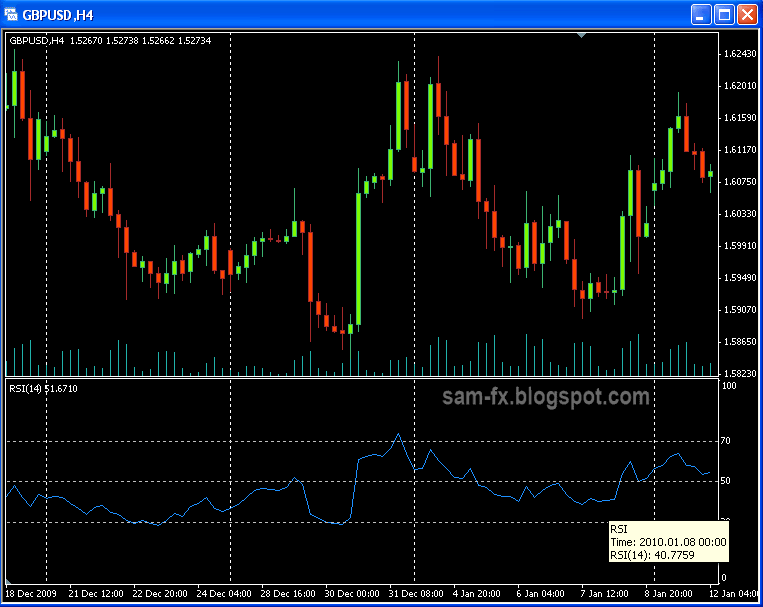
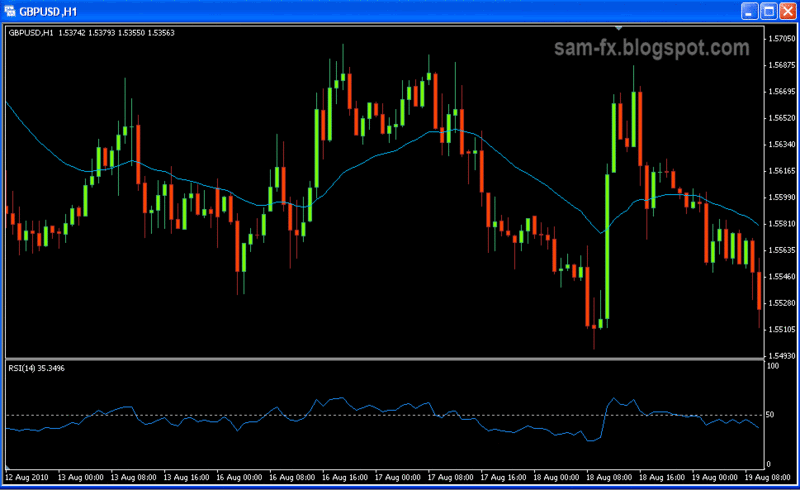
I read this in an article in Currency Traders. It is said that RSI is equivalent to EMA (Exponential Moving Average) two times the period of RSI. This is because the way RSI is being calculated. In the image below, I have plot out RSI 14 and EMA28. Notice that RSI will be below center line when the price is below EMA; and RSI will be above the center line when the price is above the EMA. 


The default value for RSI is 14. It is said that the best period for RSI will based on the price cycle divided by 2. If the price cycle is 28 period, than RSI 14 is recommended.


Trend determination
RSI is a momentum indicator; however it can be used to determine a trend too. I learn this from an article by John Hayden. Andrew Cardwell have studied and developed many new usages for RSI. Using RSI to determine trend is one of it.

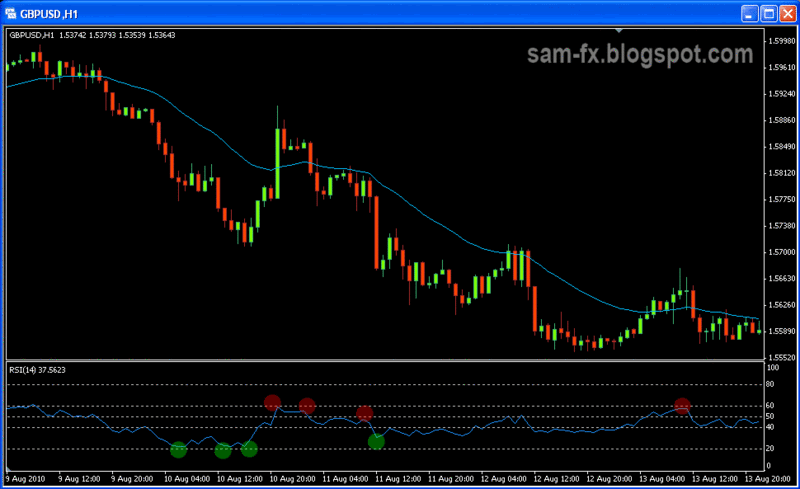
In and uptrend market, when the price is trending, the RSI will find its support around level 40 and resistance around level 80. The RSI will makes higher lows and highs.

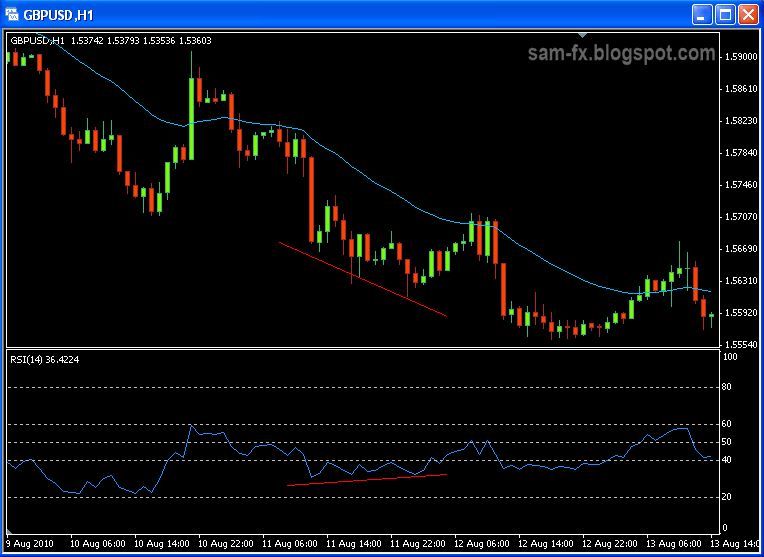
In a downtrend market, when price is trending, the RSI will find its support around level 20 and resistance around level 60. The RSI will make a lower lows and lower highs.

In the example below we have a down trending market, with RSI around level 60 and 20.


Divergence in RSI
I read this in the article by John Hayden. What shock me is this is absolutely opposite from what I read from typical textbook. And what surprise me more is he is absolutely right.

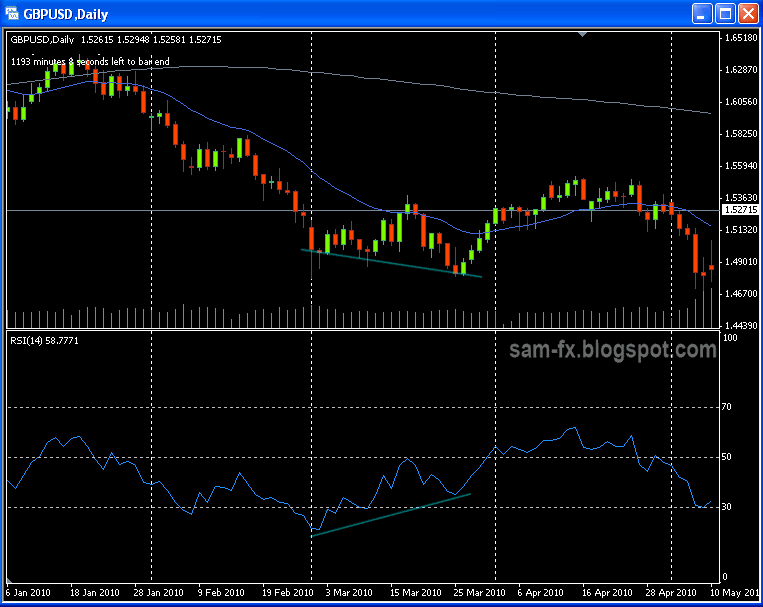
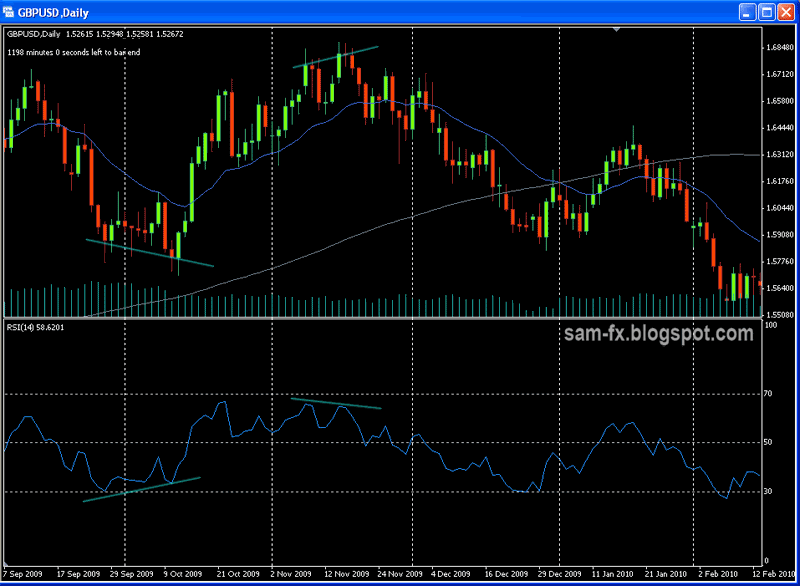
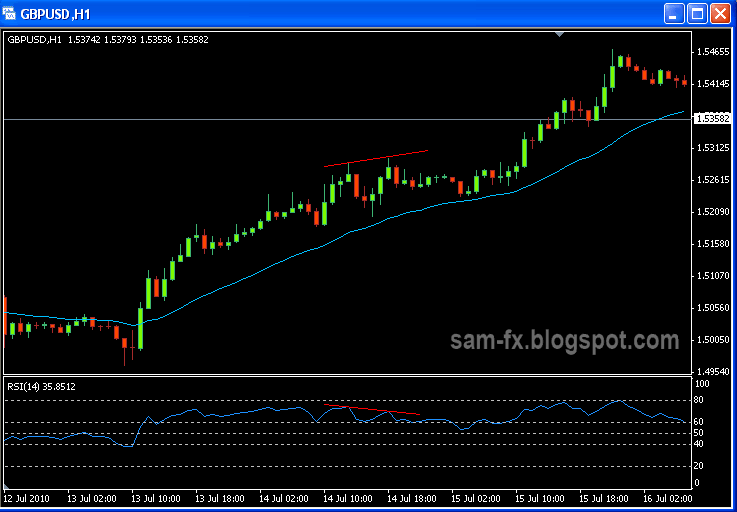
According to John, when bearish divergence happens in uptrend, he will think of Bull Market. In this situation he will be looking for opportunities to go long.

When bullish divergence happens in downtrend, he will think of bear market. In this situation he will be looking for opportunities to go short.

And this is very much correct. Below I have some few example of it.


Here you are, 3 pieces of important information for RSI. Use it wisely and it will bring more earning to you.

Read more!

Wednesday, 21 July 2010

basic: Relative Strength Index (RSI)

Relative Strength Index (RSI), another momentum indicator which is one of the most indicators for traders. RSI developed by J. Welles Wilder at 1978. It measures the relative strength within the price low and high over a period of time. I often used this together with other indicator such as stochastic for double confirmation. When I first learn Forex I thought RSI just a matter of observing the 30 and 70 levels only, however there are more to it when I learn it deeper. Here I would share more about RSI.


RSI indicator move around between level 0 and 100. It is calculated by the average gain and loss of a price. It is price based indicator, as opposed t o Money Flow Index (MFI) which is volume based indicator. The formula for RSI is beyond the discussion here. There are many different formulas out there, but this one i found at stockcharts.com is the most accurate one. (http://stockcharts.com/school/doku.php?id=chart_school:technical_indicators:relative_strength_index_rsi)
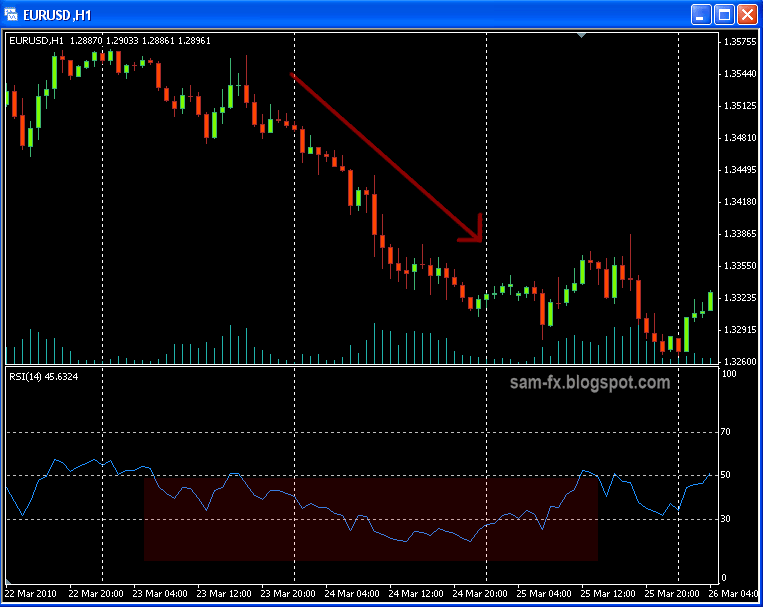
This is how RSI indicator looks like

 
Welles recommends the period to be 14, but it can be changed based on traders preference. Besides 14, the most popular period being used is 9 and 25. Lower the period will result in more oscillation, but also increase chances of false signal.


Overbought / Oversold
RSI oscillate between 0 and 100. When the level is over 70, it is considered overbought. When the level is below 30, it is consider oversold.

Traders often take it as short signal when RSI is over 70 and long signal when RSI is below 30. This is not always right things to do because in strong trend, RSI will stay in the oversold/overbought territory for some time. Usually check with candlestick patterns and confirmations with other indicators are needed to make the trade. When RSI move out from overbought/oversold territory, it is good signal to enter.


Divergence
Divergence is another way to use RSI. When price makes a higher high but RSI fail to make a higher high, a reversal is near. When price making a lower low but RSI makes a higher low, a reversal is possible too.

Note that in strong trend, divergences are misleading. In my opinion, RSI shows more misleading divergence compared to stochastic.
The price is making a new low, but the RSI is making higher low.

Another view of divergence


Centre line crossover
The level 50 line is good area to determine bullish and bearish trend. When RSI fall below 50, the bear is stronger, when RSI rise above 50, the bull is stronger. On a moving trend, RSI crosses the 50 level is a confirmation of trend movement.
Bearish center line cross over

Bearish center line cross over


RSI trend line
Another way to use RSI is drawing trend line at RSI indicator itself. Similar to trend line trading, but the line is drawn on the RSI signal line. This is useful because reversal on the trend line often seen earlier in RSI then at the price chart.

RSI trend line. Not always easily visible

Failure swings
Failure swing is not related to price chart. A bullish failure swing is when RSI dip below 30, bounce up, then down again, and when the line cross the previous height, this is failure swing. The opposite happens for bearish failure swing. Failure swing is a good signal on possible reversal of the trend.


Unlike the stochastic, signals in RSI are rare and harder to spot. But once they appear, it can be very significant. Use it wisely and it may bring you many profitable trade.


Read more!