Showing posts with label candlesticks. Show all posts

Tuesday, 13 July 2010

basic: more candlesticks

In the last posting I talk about some of the most common candlesticks pattern. Here I would like to talk a few more common candlestick combination. Hope this will help out everyone who starts learning forex. The photos below are screen capture from my charting software. Please feel free to leave your comments.


Star position

Star position is where a candlestick with small body appears gap up (or gap down) from the previous candlestick. The first candlestick should have large body, while the second candlestick should have fairly small body. The second candlestick can be a Doji, Hammer/Inverted hammer, hanging man or shooting star.

The star position usually means there is potential reversal happening.


Harami Position (孕み)
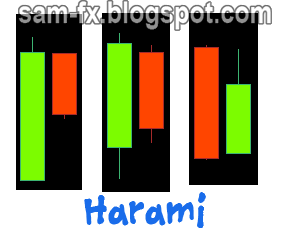
Harami, means “pregnant” in Japanese. In this position, the second candle is fully ‘enclosed’ in the fist candle. The first candle should have fairly large body, and the second candle body (and usually the shadow too) should be within the body of the first candle.

Harami used to confirm a reversal that is happening. The color of both candlesticks should not be important. The color can be in any of the 4 combination.


Engulfing
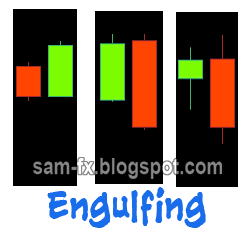
Engulfing is a pattern where the second candle fully ‘engulfs’ the first candle. In a bullish engulfing, the open of the second candle is lower than the low of first candle, while the close of the second candle is higher than the high first candle.

In a bearish engulfing, the open of the second candle is higher than the high of  first candle, and the close of the second candle is lower than the low of the first candle.

Usually engulfing means a potential reversal is happening. Confirmation with indicators and subsequent candles are required on the reversal.


Piercing / dark Cloud Over
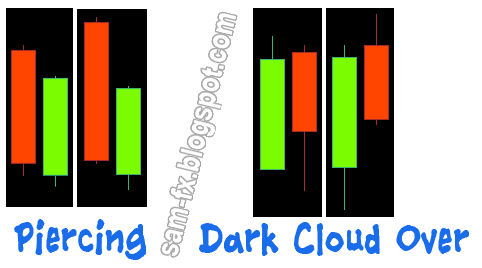
These 2 are also potential reversal pattern. A piercing is pattern with 2 candles, the open of second candle is lower than the low of first candle, and the close of the second candle should be above the ½ body of the first candle.

In the dark-cloud-over formation, the open of the second candle should be higher than the high of the first candle, and the close of the second candle should be lower than half of body of the first candle.


Read more!

Monday, 12 July 2010

books: Candlestick Reference

Here are some good books you can reference about candlesticks chart. These are good reference if you wants to learn deeper about candlesticks chart


Read more!

basic: Talk candle, eat candle, sleeps candle, dream candle

In my previous post I have describe the anatomy of a candlestick, and also the Doji candlestick. There are many more candlestick patterns out there; there are even more candlestick formation out there to study. Here I would highlight some of the more common candlestick patterns for you.

The Doji have been mentioned in the previous blog. Its one of the most significant candlestick patterns out there.

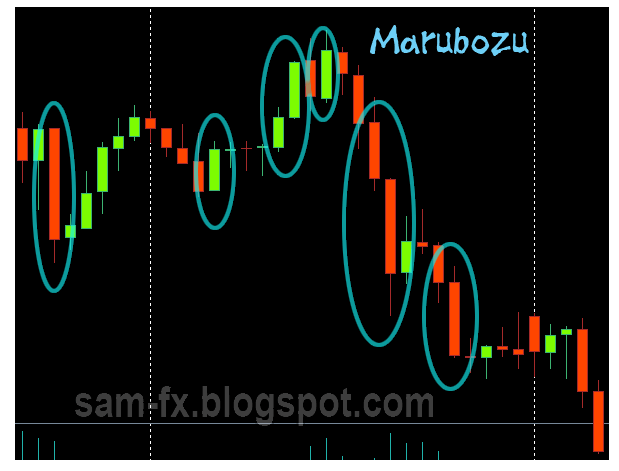
The Marubozu (まるぼず)

The Marubozu is a candle with long body and no shadow/wicks. Sometimes there will be shadow but usually its very short. If Marubozu candlestick is real person, it will be like “Yao Ming” in the real world, very tall.

The Marubozu usually means the bullish/bearish trend is strong, and usually (but not always) signal a continuation. Marubozu with shadow are significant too, usually the shadow are short. A “closing Marubozu” have stronger meaning then an “opening Marubozu”. A “closing Marubozu” is a Marubozu which have a short shadow only at the the opening end; and vice versa for the “opening Marubozu”.


Spinning tops
 These are candlestick that similar to a Doji. The difference is they have a very small body (oppose to Doji which do not have a body) and a very long top/bottom shadow.

The appearance of spinning tops after a trend means the trend is weakening. It might be a sign of reversal. Using it with indicators will give you higher accuracy on spotting a reversal.


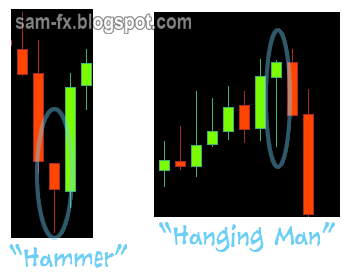
Hammer / Hanging man
 A hammer or hanging man candlestick looks the same. They have a very long lower shadow; very short or non-existence upper shadow, and a very small body. They can be black or white (red or green) candles. We call them “hammer” when they appear at end of downtrend, and we call them “hanging man” when they appear at end of up trend.

Usually the appearance will signal a reversal. But we will need to wait for confirmation candlestick and also with help of indicators.


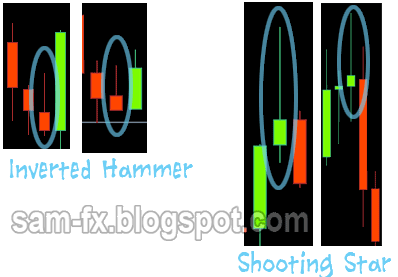
Inverted hammer / shooting star
 These 2 candles are the same. They have very long upper shadow, a very short body, and very short or non-existence lower shadow. We call them “inverted hammer” when they appear in downtrend, and we call them “shooting star” when they appear in uptrend.

Usually their appearance will signal a reversal. But we will wait for a confirmation candle, and also with the help of indicators.


There you go, few of the more common candlesticks. At next post we will goes into candlestick formation.

Here are some readings to boost your knowledge on candlesticks.


Read more!

basic: CandleSticks

The Candlestick Chart was invented by the ancient Japanese to monitor price movement of the rice. Thanks to Steve Nison who brings it to modern trading world, the Candlestick is now serving many traders out there. Here I will share the very basic of the candle stick with some of my own illustration for easy understanding.

A candlestick, similar to a bar chart, represents OHLC (Opens, high, low, close). Below is illustration of the candle stick.
The top part and the bottom part is called the “wick”, or “shadow”. The very top and very bottom represents the high and low during the period.

The wide part in the middle is her “body”. The body is between the open and close price. Candlestick may have different color body, or hollow/solid body to represents higher opens, lower close, or lower opens, higher close.

At a glance of series of candlesticks with their different colors and size, it can give a good picture of how the price behaves. Candlestick with different body size and different shadow size will give a clue on the price movements too.


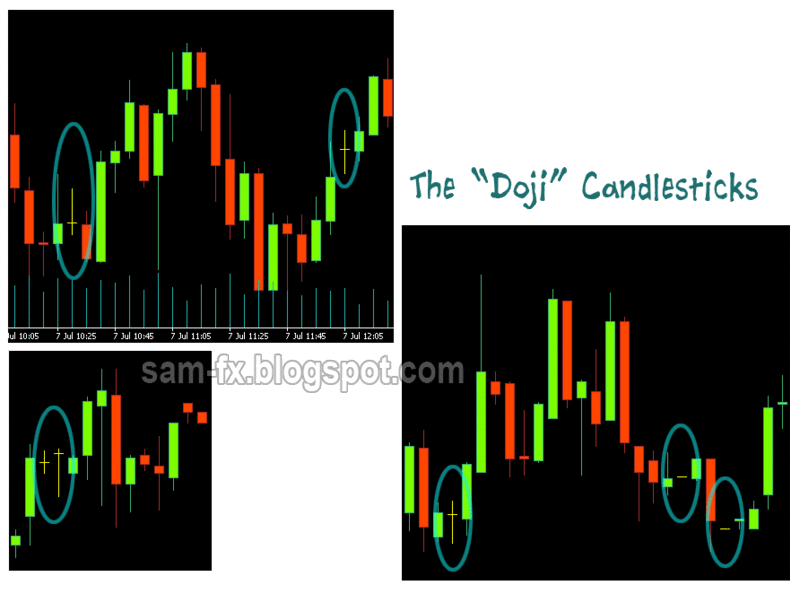
The Doji (どじ)

This is one of the most significant candlestick patterns around. Basically it’s a candlestick where the open and close prices are the same. Usually they are in the form of “+”. But they could be a form of “-“(no price movement at all);
“T” (same open and close, with lower price movement in between, “dragonfly doji”);
“_|_” (same open and close, with higher price movement in between, “gravestone doji”);
Below are some “Doji” I screencaptured from my charting software.

Many articles saying that Doji appeared will represents reversal is near. From my experience this is true sometimes. The Doji might mean continuation too. What I usually do is waiting for the next candle to close to make my judgment. The Doji appear after a rally meaning that one side of the bulls/bears are exhausted, it might means a reversal (the other side power up), or it might means a continuation too (taking a pause). The way to be sure is to wait for next candle close to confirm it.

Read more!