Showing posts with label volume. Show all posts

Wednesday, 4 August 2010

basic: On Balance Volume Indicator

In my previous post I talked about volume in forex. Now I will talk about a volume based indicator. I just learn about this indicator not long ago. This is because I noticed that all the indicators I use are price-based. It’s time to pick up some volume based indicator to add in my tool box too. On Balance Volume (OBV) is developed long time ago, in year 1963 to show the money flow in and out in the market.


Volume is quite important in technical analysis. The volume is calculated in ticks movement in forex. But volume only shows increasing or decreasing on the change of ticks. OBV somehow gives direction to the volume. This will show buying or selling pressure.
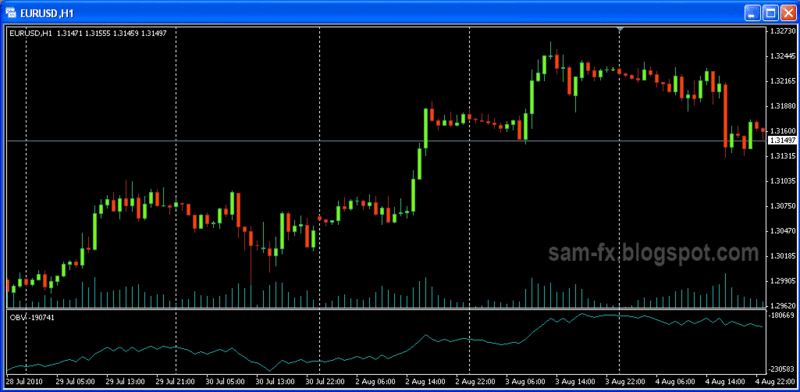
The On Balance Volume Indicator

Calculation
OBV is calculated with the volume and price. OBV starts with 0. When a price is close higher, the volume of that bar is added into OBV. When the price closes lower, the volume is subtracted. Thus the number values in OBV have no significant meaning. What’s more important is the chart pattern and direction of OBV.


Healthy trend / Unhealthy trend
When uptrend occurs, a rising in OBV chart will shows that the trend is strong. This is because there are more volume that support the uptrend. When a downtrend occurs, a downtrend in OBV chart will show that the trend is strong.


Trading OBV trend-line
Trend line can be drawn on OBV, the same way that they are drawn in price chart. Traders look at OBV trend line because they believe in the concept “volume precede price”. Short and long signal are trigger once the trend line are broken. This is the same method use in trend line trading, once of the simplest form of trading.
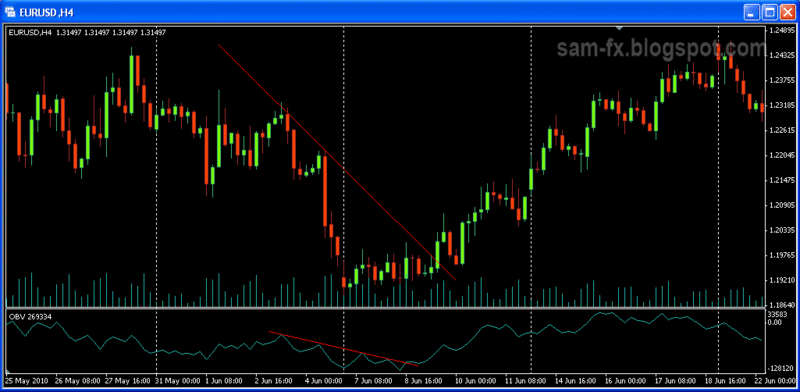
Trend line trading with OBV

Divergence
Divergence in OBV shows the trend is weakening. This is same method use when looking at other indicators. 
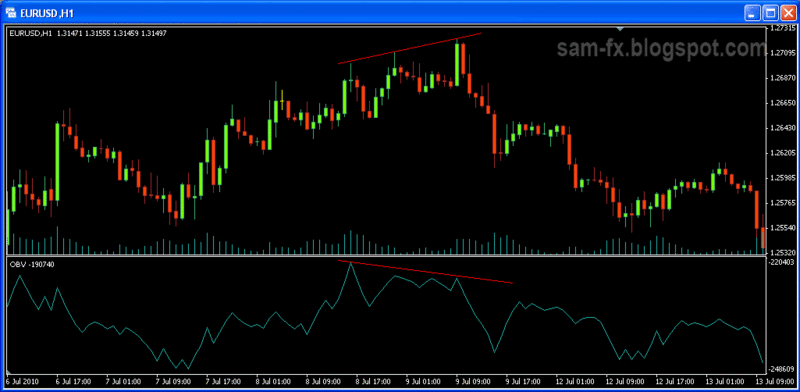
 Example of Divergence in OBV


Read more!

Monday, 2 August 2010

Basic: Volume

Volume and price are the 2 purest forms of data in technical analysis. All other indicators are based mostly on price and some on volumes. Unlike the share market, where each share traded is considered to be 1 volume, the volume in forex is calculated differently. This is because forex doesn’t have a centralized exchange, thus the calculation is different.


In forex, the volume is calculated by the amount of movement in the price. The movements are known as ticks. Thus the ticks movement represents a number in volume. Volume in forex measures the “worth” of the market move. Movement that backed by high volume are more significant. There is a saying that says “volume precedes price”, where volume is consider leading indicator.


Healthy Trend & Unhealthy Trend
A healthy trend is a trend backed up by increasing volume data. In an uptrend, an increasing in volume while the trend is moving up is considered a healthy trend. In a downtrend, an increasing in volume while trend is moving down is healthy trend.

A trend with decreasing volume is indication that the trend is weakening. Example in and uptrend, when the volume starts decreasing, the top is near, and the trend might starts to move sideway or reversal soon.


Accumulation
Accumulation is where the bulls take control of the game. In a down trend, accumulation happens when the price start moving sideway (or start moving up slightly), with the pick up on volume. After that reversal is possibly going to happens soon.

Distribution
Distribution is terms to describe the bears take control of the game. In an up trend, distribution is where the trend starts moving sideway (or slightly moving down) with increasing volume. After that reversal is most probably going to happens.


Volume spike and reversal
Area with more volume can be observed as significant support/resistance area. When many volume spikes appear in an area, it is possible that reversal is going to happens. A single spike on the other hand might be caused of news announcement.


Volume and breakout
Volume data can be used to confirm a breakout. Breakout is where the chart starts to move after some chart pattern formation. A breakout with low volume might be fake breakout. A breakout with large volume is more significant, and price is likely to move to targeted profit level.


Volume Based Indicator
Volume based indicator are less common than price based indicators. Here are some more popular volume based indicators.
  • Volume bar on the chart on MT4
  • Volume
  • Money Flow Index
  • Market Facilitation Index
  • On Balance Volume
  • Accumulation / Distribution

Read more!